Supported by Dr. Osamu Ogasawara and  . . |
|
Last data update: 2014.03.03 |
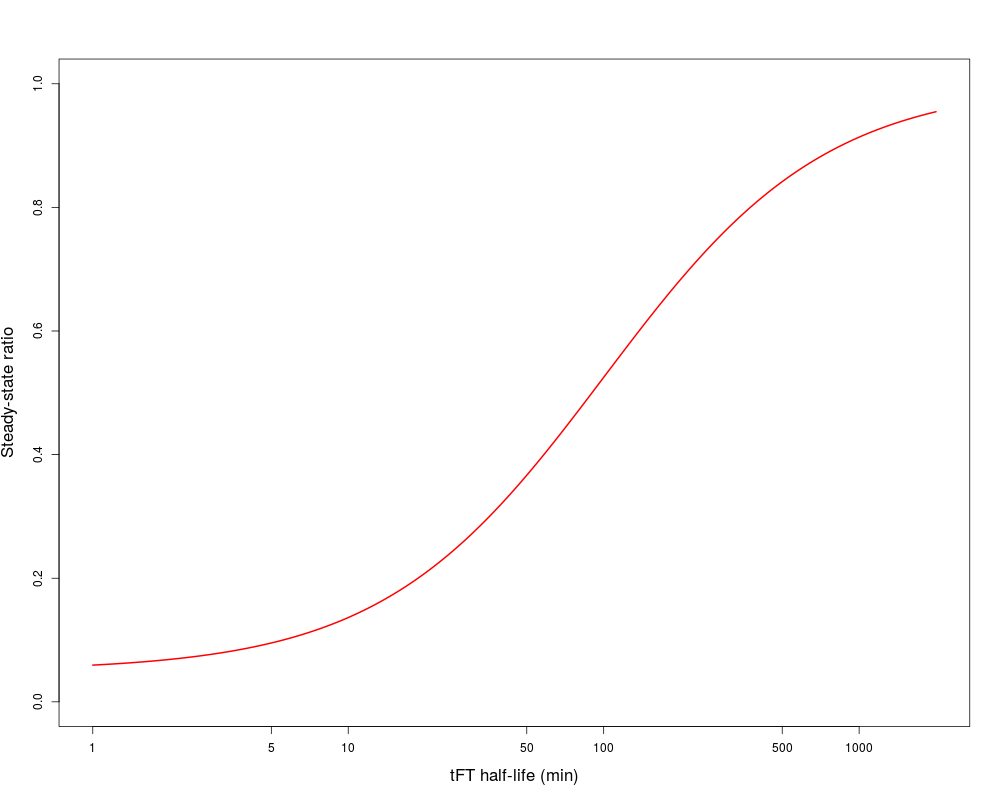
analytic function ratioSteadyStateDescriptionSteady-state analytic solution to one-step model for the ratio of mature to non-mature fluorophores. UsageratioSteadyState(T1, T2, halfLife, E=0, f=1) Arguments
ValueA numeric specifying the model steady-state solution for the given parameters. Author(s)Joseph D. Barry Examples
halfLifeSeq <- seq(1, 2000, by=0.1)
plot(halfLifeSeq, ratioSteadyState(T1=5, T2=100, halfLife=halfLifeSeq),
    type="l", lwd=2, ylim=c(0, 1), xlab="tFT half-life (min)",
    ylab="Steady-state ratio", cex.lab=1.4, log="x", col="red")
Results
R version 3.3.1 (2016-06-21) -- "Bug in Your Hair"
Copyright (C) 2016 The R Foundation for Statistical Computing
Platform: x86_64-pc-linux-gnu (64-bit)

R is free software and comes with ABSOLUTELY NO WARRANTY.
You are welcome to redistribute it under certain conditions.
Type 'license()' or 'licence()' for distribution details.

R is a collaborative project with many contributors.
Type 'contributors()' for more information and
'citation()' on how to cite R or R packages in publications.

Type 'demo()' for some demos, 'help()' for on-line help, or
'help.start()' for an HTML browser interface to help.
Type 'q()' to quit R.

> library(TimerQuant)
Loading required package: shiny
> png(filename="/home/ddbj/snapshot/RGM3/R_BC/result/TimerQuant/ratioSteadyState.Rd_%03d_medium.png", width=480, height=480)
> ### Name: ratioSteadyState
> ### Title: analytic function ratioSteadyState
> ### Aliases: ratioSteadyState
> ### Keywords: ratioSteadyState
>
> ### ** Examples
>
> halfLifeSeq <- seq(1, 2000, by=0.1)
> plot(halfLifeSeq, ratioSteadyState(T1=5, T2=100, halfLife=halfLifeSeq),
+     type="l", lwd=2, ylim=c(0, 1), xlab="tFT half-life (min)",
+     ylab="Steady-state ratio", cex.lab=1.4, log="x", col="red")
>
>
>
>
>
> dev.off()
null device
          1
>
|
Created & Maintained by Osamu Ogasawara (osamu.ogasawara@gmail.com) and 