R: Analytic model solutions for fluorescence intensity
analyticSolutions
R Documentation
Analytic model solutions for fluorescence intensity
Description
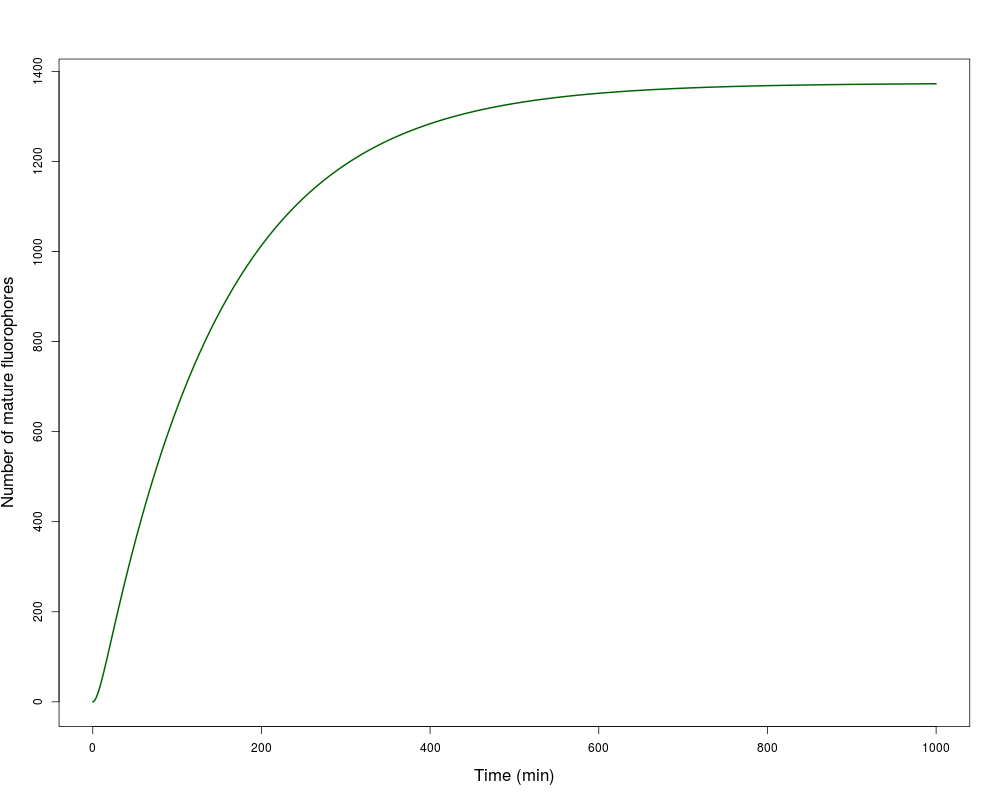
Time-dependent and steady-state analytic solution to one-step model for number
of mature fluorophores. Where f is given as a parameter the returned
value is transformed from a molecular population into a fluorescence intensity.
For the function names, 0 refers to the dark population of non-mature
fluorophores, and 1 to the mature, fluorescent population. 'ss' indicates
steady-state solutions. tss is the time required to reach steady-state.
Usage
tss(m, k)
x0ss(p, m, k)
x1(p, m, k, t, f=1)
x1ss(p, m, k, f=1)
x1fretFP1(p, m1, m2, k, t, E=0, f=1)
x1fretFP1ss(p, m1, m2, k, E=0, f=1)
Arguments
p
Protein production rate (molecules produced per unit time).
m
Maturation rate of fluorophore, which can be for either FP1 or FP2 (convert to
maturation time with log(2)/m).
m1
Maturation rate of FP1.
m2
Maturation rate of FP2.
k
Protein degradation rate (convert to half-life with log(2)/k).
t
Time (must be non-negative).
E
FRET coefficient representing energy transfer from FP1 to FP2.
f
Proportionality factor relating intensity to the number of molecules. When equal
to one then the readout is number of molecules directly.
Value
A numeric specifying the model solution for the given parameters.
R version 3.3.1 (2016-06-21) -- "Bug in Your Hair"
Copyright (C) 2016 The R Foundation for Statistical Computing
Platform: x86_64-pc-linux-gnu (64-bit)

R is free software and comes with ABSOLUTELY NO WARRANTY.
You are welcome to redistribute it under certain conditions.
Type 'license()' or 'licence()' for distribution details.

R is a collaborative project with many contributors.
Type 'contributors()' for more information and
'citation()' on how to cite R or R packages in publications.

Type 'demo()' for some demos, 'help()' for on-line help, or
'help.start()' for an HTML browser interface to help.
Type 'q()' to quit R.

> library(TimerQuant)
Loading required package: shiny
> png(filename="/home/ddbj/snapshot/RGM3/R_BC/result/TimerQuant/x1.Rd_%03d_medium.png", width=480, height=480)
> ### Name: analyticSolutions
> ### Title: Analytic model solutions for fluorescence intensity
> ### Aliases: tss x0ss x1 x1ss x1fretFP1 x1fretFP1ss
> ### Keywords: x1
>
> ### ** Examples
>
> t0 <- seq(0.001, 1000, by=0.1)
> plot(t0, x1(p=10, m=log(2)/5, k=log(2)/100, t=t0), type="l", col="darkgreen",
+     lwd=2, xlab="Time (min)", ylab="Number of mature fluorophores", cex.lab=1.4)
>
>
>
>
>
> dev.off()
null device
          1
>
 .
.