Supported by Dr. Osamu Ogasawara and  . . |
|
Last data update: 2014.03.03 |
Panel function for adding a P-spline smoothed curves to a lattice graphics panelDescriptionThe function panel.pspline is similar to panel.loess but show the P-spline smoothed curve. Usagepanel.pspline(x, y, weights = rep(1, length(y)), nintervals = 100, type, horizontal = FALSE, col.line=1, lty=1, lwd=1, ...) Arguments
Details?panel.loess Author(s)Maarten van Iterson and Chantal van Leeuwen ReferencesDeepayan Sarkar (2009). lattice: Lattice Graphics. R package version 0.17-26. http://CRAN.R-project.org/package=lattice van Iterson M, Duijkers FA, Meijerink JP, Admiraal P, van Ommen GJ, Boer JM, van Noesel MM, Menezes RX (2012). A novel and fast normalization method for high-density arrays. SAGMB, 11(4). Paul .H.C. Eilers and Brain D. Marx (1996). Flexible smoothing with B-splines and Penalties. Statistical Science, Vol 11, No. 2, 89-121. See Also
Examples
library(marray)
library(lattice)
data(swirl)
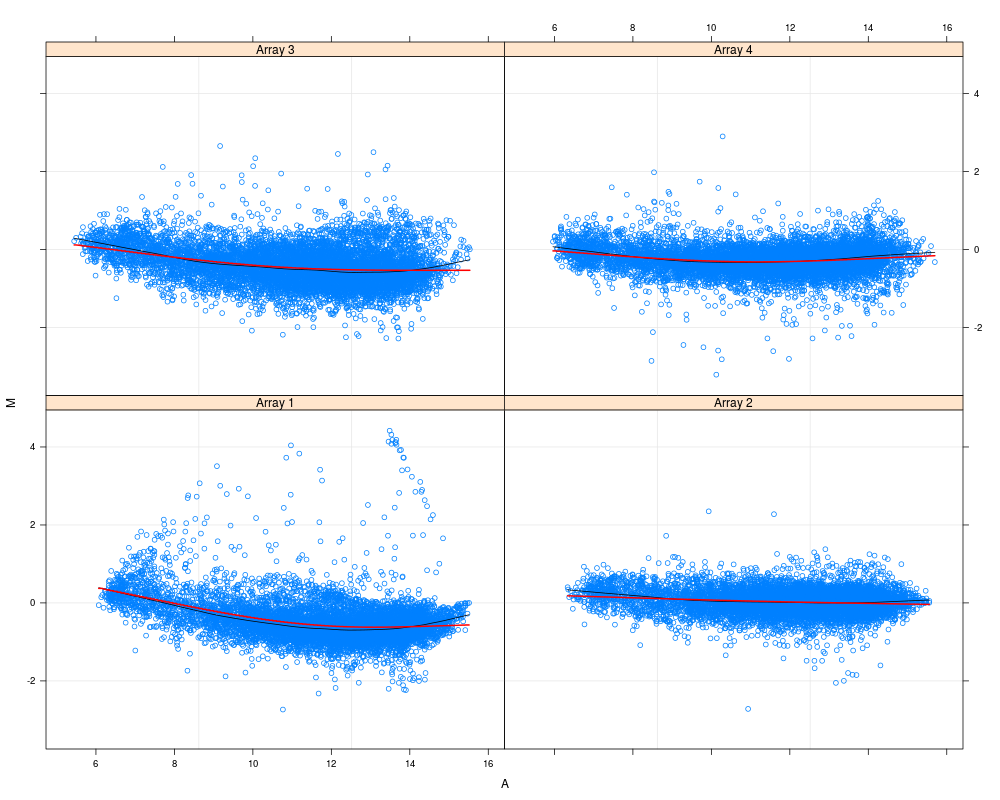
data <- data.frame(M=as.vector(maM(swirl)), A=as.vector(maA(swirl)), Sample=rep(paste("Array", 1:4), each=nrow(swirl)))
xyplot(M~A|Sample, data=data,
panel = function(x, y) {
panel.grid(h=-1, v= 2)
panel.xyplot(x, y)
panel.loess(x, y, span=0.25, col="black")
panel.pspline(x, y, col="red", lwd=2)})
Results
R version 3.3.1 (2016-06-21) -- "Bug in Your Hair"
Copyright (C) 2016 The R Foundation for Statistical Computing
Platform: x86_64-pc-linux-gnu (64-bit)

R is free software and comes with ABSOLUTELY NO WARRANTY.
You are welcome to redistribute it under certain conditions.
Type 'license()' or 'licence()' for distribution details.

R is a collaborative project with many contributors.
Type 'contributors()' for more information and
'citation()' on how to cite R or R packages in publications.

Type 'demo()' for some demos, 'help()' for on-line help, or
'help.start()' for an HTML browser interface to help.
Type 'q()' to quit R.

> library(TurboNorm)
Loading required package: convert
Loading required package: Biobase
Loading required package: BiocGenerics
Loading required package: parallel

Attaching package: 'BiocGenerics'

The following objects are masked from 'package:parallel':

    clusterApply, clusterApplyLB, clusterCall, clusterEvalQ,
    clusterExport, clusterMap, parApply, parCapply, parLapply,
    parLapplyLB, parRapply, parSapply, parSapplyLB

The following objects are masked from 'package:stats':

    IQR, mad, xtabs

The following objects are masked from 'package:base':

    Filter, Find, Map, Position, Reduce, anyDuplicated, append,
    as.data.frame, cbind, colnames, do.call, duplicated, eval, evalq,
    get, grep, grepl, intersect, is.unsorted, lapply, lengths, mapply,
    match, mget, order, paste, pmax, pmax.int, pmin, pmin.int, rank,
    rbind, rownames, sapply, setdiff, sort, table, tapply, union,
    unique, unsplit

Welcome to Bioconductor

    Vignettes contain introductory material; view with
    'browseVignettes()'. To cite Bioconductor, see
    'citation("Biobase")', and for packages 'citation("pkgname")'.

Loading required package: limma

Attaching package: 'limma'

The following object is masked from 'package:BiocGenerics':

    plotMA

Loading required package: marray
> png(filename="/home/ddbj/snapshot/RGM3/R_BC/result/TurboNorm/panel.pspline.Rd_%03d_medium.png", width=480, height=480)
> ### Name: panel.pspline
> ### Title: Panel function for adding a P-spline smoothed curves to a
> ###   lattice graphics panel
> ### Aliases: panel.pspline
> ### Keywords: hplot
>
> ### ** Examples
>
>
> library(marray)
> library(lattice)
> data(swirl)
> data <- data.frame(M=as.vector(maM(swirl)), A=as.vector(maA(swirl)), Sample=rep(paste("Array", 1:4), each=nrow(swirl)))
>
> xyplot(M~A|Sample, data=data,
+                         panel = function(x, y) {
+             panel.grid(h=-1, v= 2)
+             panel.xyplot(x, y)
+             panel.loess(x, y, span=0.25, col="black")
+                                                 panel.pspline(x, y, col="red", lwd=2)})
>
>
>
>
>
>
> dev.off()
null device
          1
>
|