Supported by Dr. Osamu Ogasawara and  . . |
|
Last data update: 2014.03.03 |
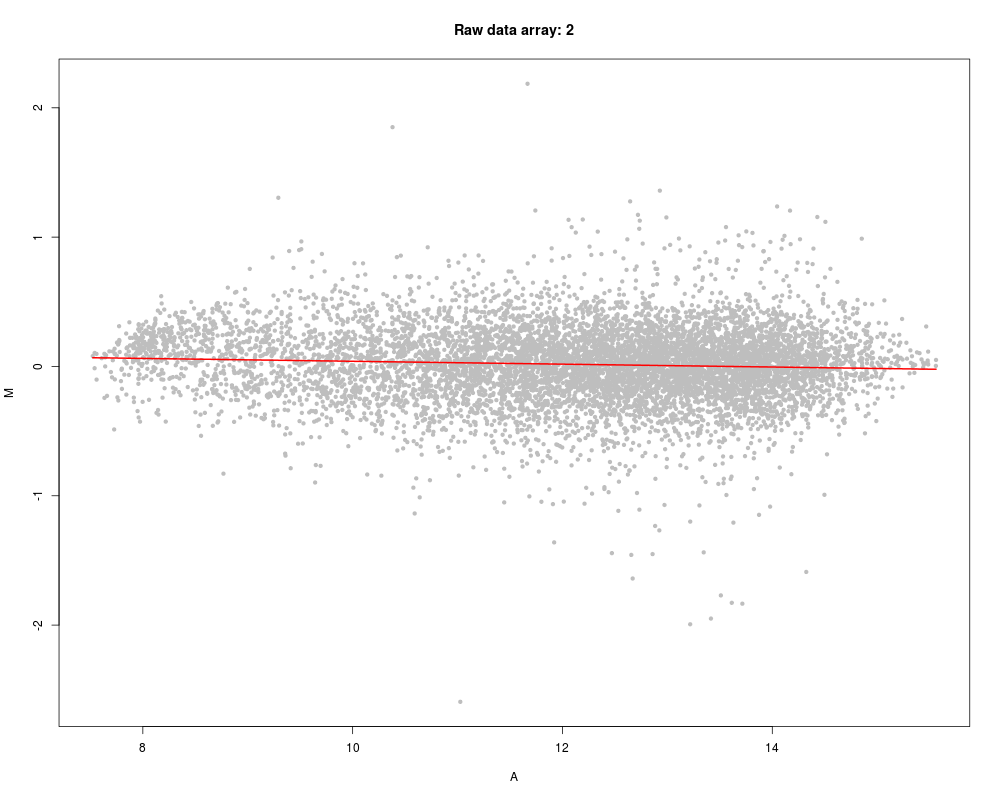
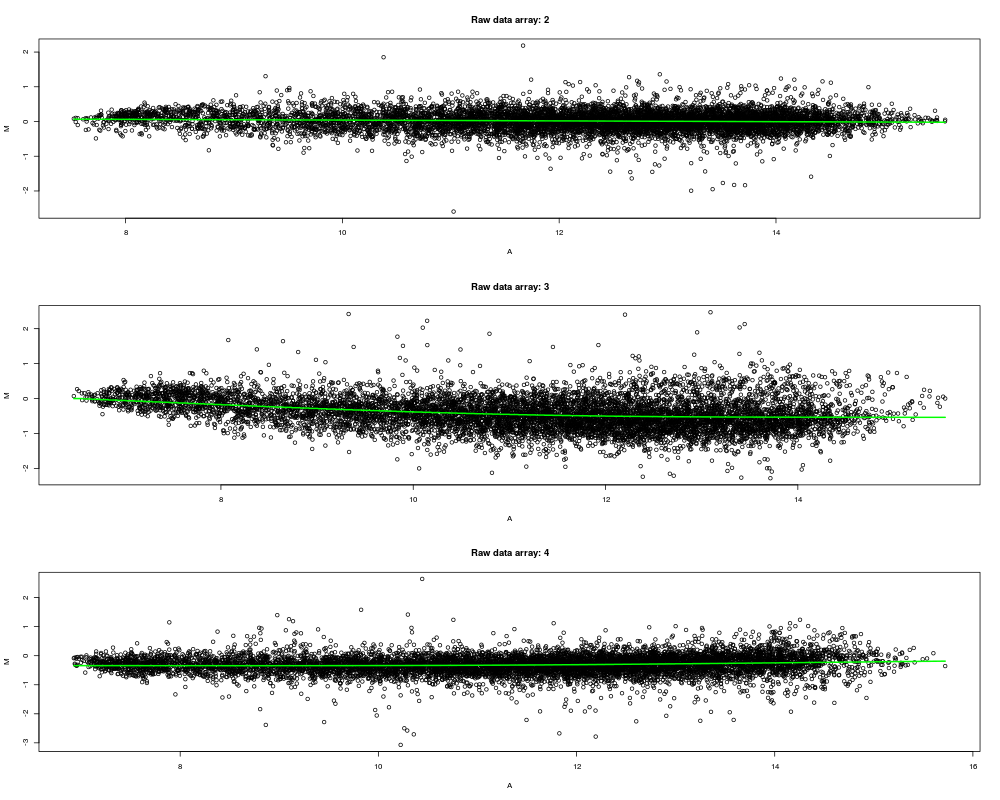
Function for two-colour microarray data normalization using the P-splinesDescriptionWrapper function for two colour microarray data normalization using the P-spline smoother suitable for a RGList- or MarrayRaw-objects. Usagepspline(object, background = c("none", "substract"), weights = NULL, nintervals = 100, subset=NULL, showArrays = 0, verbose=FALSE, line.col=2, line.lty=1, line.lwd=2, ...)
Arguments
.
Detailsif necessary? ValueThe value that will be returned is either a MAList or MarrayNorm-object dependening on the input type. Author(s)Chantal van Leeuwen and Maarten van Iterson Referencesvan Iterson M, Duijkers FA, Meijerink JP, Admiraal P, van Ommen GJ, Boer JM, van Noesel MM, Menezes RX (2012). A novel and fast normalization method for high-density arrays. SAGMB, 11(4). Paul .H.C. Eilers and Brain D. Marx (1996). Flexible smoothing with B-splines and Penalties. Statistical Science, Vol 11, No. 2, 89-121. See Also
Exampleslibrary(marray) data(swirl) x <- pspline(swirl, showArrays=2, pch=20, col="grey") x <- pspline(swirl, showArrays=2:4, line.col="green") Results
R version 3.3.1 (2016-06-21) -- "Bug in Your Hair"
Copyright (C) 2016 The R Foundation for Statistical Computing
Platform: x86_64-pc-linux-gnu (64-bit)

R is free software and comes with ABSOLUTELY NO WARRANTY.
You are welcome to redistribute it under certain conditions.
Type 'license()' or 'licence()' for distribution details.

R is a collaborative project with many contributors.
Type 'contributors()' for more information and
'citation()' on how to cite R or R packages in publications.

Type 'demo()' for some demos, 'help()' for on-line help, or
'help.start()' for an HTML browser interface to help.
Type 'q()' to quit R.

> library(TurboNorm)
Loading required package: convert
Loading required package: Biobase
Loading required package: BiocGenerics
Loading required package: parallel

Attaching package: 'BiocGenerics'

The following objects are masked from 'package:parallel':

    clusterApply, clusterApplyLB, clusterCall, clusterEvalQ,
    clusterExport, clusterMap, parApply, parCapply, parLapply,
    parLapplyLB, parRapply, parSapply, parSapplyLB

The following objects are masked from 'package:stats':

    IQR, mad, xtabs

The following objects are masked from 'package:base':

    Filter, Find, Map, Position, Reduce, anyDuplicated, append,
    as.data.frame, cbind, colnames, do.call, duplicated, eval, evalq,
    get, grep, grepl, intersect, is.unsorted, lapply, lengths, mapply,
    match, mget, order, paste, pmax, pmax.int, pmin, pmin.int, rank,
    rbind, rownames, sapply, setdiff, sort, table, tapply, union,
    unique, unsplit

Welcome to Bioconductor

    Vignettes contain introductory material; view with
    'browseVignettes()'. To cite Bioconductor, see
    'citation("Biobase")', and for packages 'citation("pkgname")'.

Loading required package: limma

Attaching package: 'limma'

The following object is masked from 'package:BiocGenerics':

    plotMA

Loading required package: marray
> png(filename="/home/ddbj/snapshot/RGM3/R_BC/result/TurboNorm/pspline.Rd_%03d_medium.png", width=480, height=480)
> ### Name: pspline
> ### Title: Function for two-colour microarray data normalization using the
> ###   P-splines
> ### Aliases: pspline
> ### Keywords: smooth
>
> ### ** Examples
>
>
> library(marray)
> data(swirl)
>
> x <- pspline(swirl, showArrays=2, pch=20, col="grey")
> x <- pspline(swirl, showArrays=2:4, line.col="green")
>
>
>
>
>
>
> dev.off()
null device
          1
>
|