Supported by Dr. Osamu Ogasawara and  . . |
|
Last data update: 2014.03.03 |
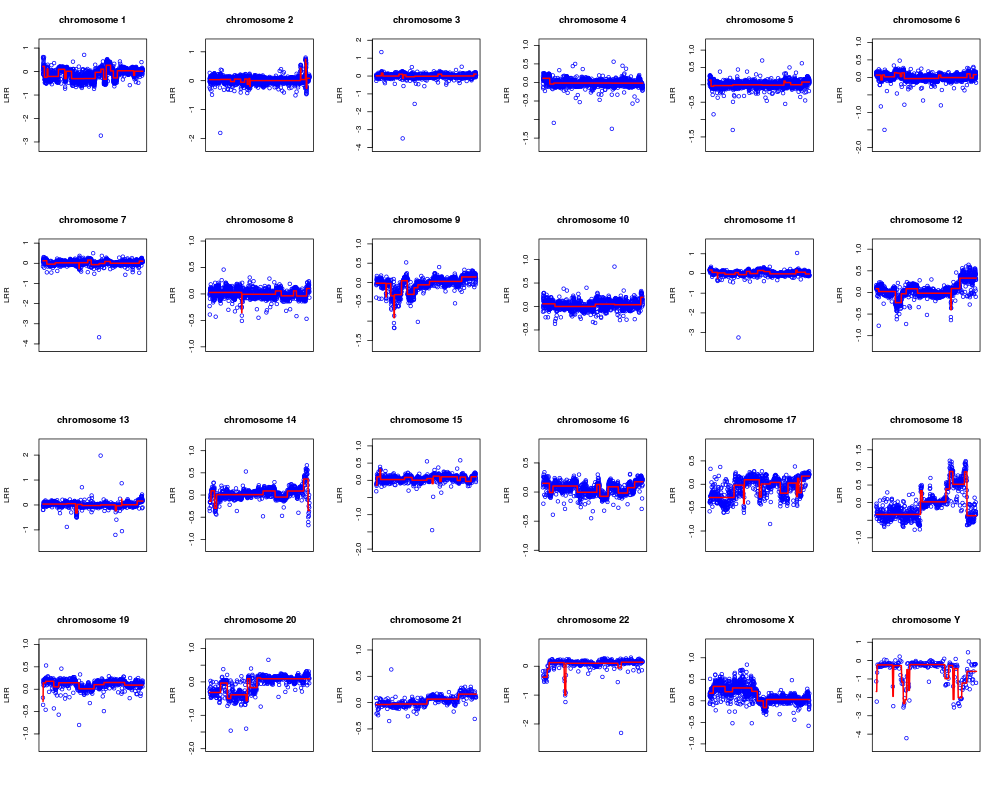
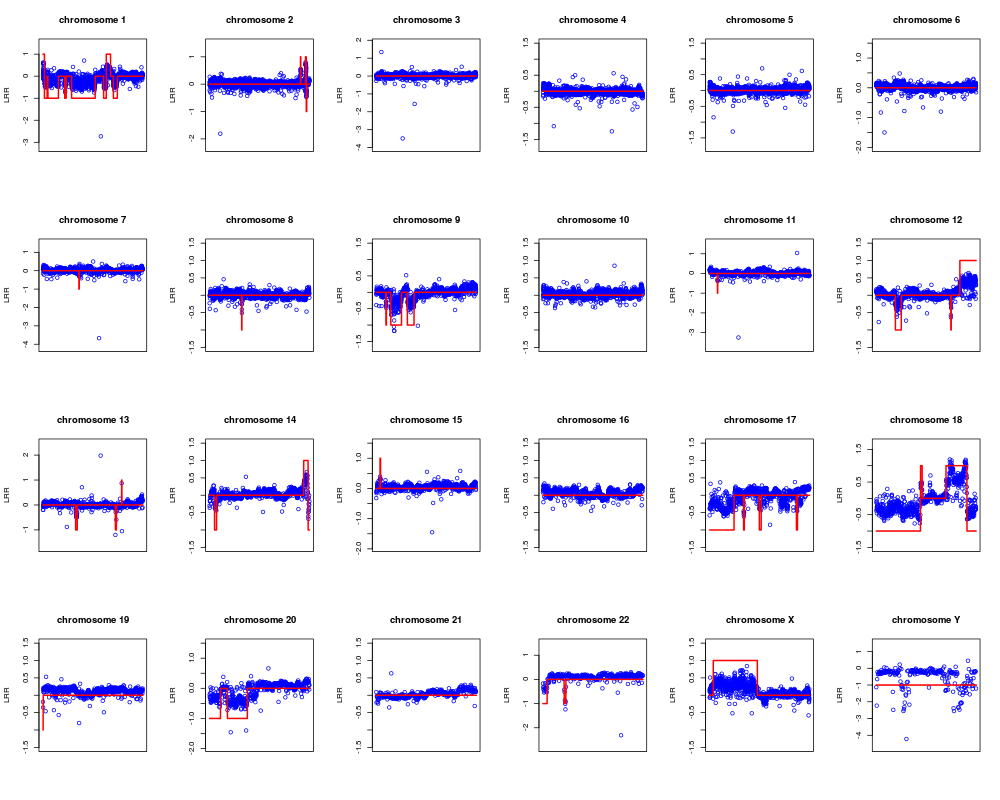
Plot observations and the respective segmentation.DescriptionThis function allows to plot the observed data superimposing the respective segmentation. By the parameter 'opt' he user can plot the LRR mean values of each segment or the computed aberration kind. In plot window the gain and the loss are identified by a line having value of 1 and -1 respectively. UsageplotSegmentation(CNVdata, segmentation, chromosomes, opt = 0) Arguments
NoteIf the argument opt=1 then gains and losses are identified by 1 and -1 respectively. Author(s)Sandro Morganella, Luigi Cerulo, Giuseppe Viglietto, Michele Ceccarelli Maintainer: Sandro Morganella <morganellaalx@gmail.com> ReferencesMorganella S. et al. (2010). VEGA: Variational segmentation for copy number detection, Bioinformatics. Examples# Import the data data(G519) # Compute the segmentation for all chromosomes seg <- vega(G519, c(1:22, "X", "Y")) # Plot the results for all chromosomes in terms of mean of LRRs plotSegmentation(G519, seg, c(1:22, "X", "Y"), opt=0) # Plot the results for all chromosomes in terms of aberration kinds plotSegmentation(G519, seg, c(1:22, "X", "Y"), opt=1) Results
R version 3.3.1 (2016-06-21) -- "Bug in Your Hair"
Copyright (C) 2016 The R Foundation for Statistical Computing
Platform: x86_64-pc-linux-gnu (64-bit)

R is free software and comes with ABSOLUTELY NO WARRANTY.
You are welcome to redistribute it under certain conditions.
Type 'license()' or 'licence()' for distribution details.

R is a collaborative project with many contributors.
Type 'contributors()' for more information and
'citation()' on how to cite R or R packages in publications.

Type 'demo()' for some demos, 'help()' for on-line help, or
'help.start()' for an HTML browser interface to help.
Type 'q()' to quit R.

> library(Vega)
> png(filename="/home/ddbj/snapshot/RGM3/R_BC/result/Vega/plotSegmentation.Rd_%03d_medium.png", width=480, height=480)
> ### Name: plotSegmentation
> ### Title: Plot observations and the respective segmentation.
> ### Aliases: plotSegmentation
>
> ### ** Examples
>
>
> 	# Import the data
> 	data(G519)
>
> 	# Compute the segmentation for all chromosomes
> 	seg <- vega(G519, c(1:22, "X", "Y"))
Processing Chromosome 1
Done

Processing Chromosome 2
Done

Processing Chromosome 3
Done

Processing Chromosome 4
Done

Processing Chromosome 5
Done

Processing Chromosome 6
Done

Processing Chromosome 7
Done

Processing Chromosome 8
Done

Processing Chromosome 9
Done

Processing Chromosome 10
Done

Processing Chromosome 11
Done

Processing Chromosome 12
Done

Processing Chromosome 13
Done

Processing Chromosome 14
Done

Processing Chromosome 15
Done

Processing Chromosome 16
Done

Processing Chromosome 17
Done

Processing Chromosome 18
Done

Processing Chromosome 19
Done

Processing Chromosome 20
Done

Processing Chromosome 21
Done

Processing Chromosome 22
Done

Processing Chromosome X
Done

Processing Chromosome Y
Done

>
> 	# Plot the results for all chromosomes in terms of mean of LRRs
> 	plotSegmentation(G519, seg, c(1:22, "X", "Y"), opt=0)
>
> 	# Plot the results for all chromosomes in terms of aberration kinds
> 	plotSegmentation(G519, seg, c(1:22, "X", "Y"), opt=1)
>
>
>
>
>
>
> dev.off()
null device
          1
>
|