R: Useful for changing the look of pairs plots to emphasize...
symbolsInteresting
R Documentation
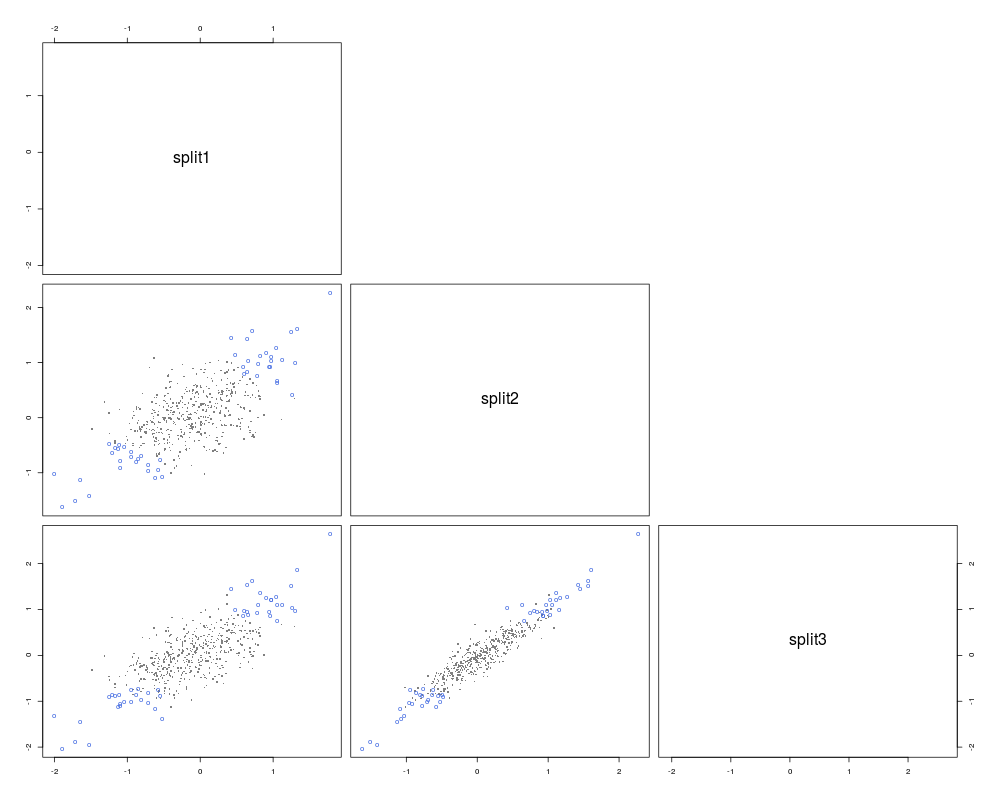
Useful for changing the look of pairs plots to emphasize
concordant or discordant genes
Description
This function can be used to order genes in a matrix by the rank of a
statistic and provide different plotting symbols and colors for genes
that exceed a certain threshold of the ranking statistic.
R version 3.3.1 (2016-06-21) -- "Bug in Your Hair"
Copyright (C) 2016 The R Foundation for Statistical Computing
Platform: x86_64-pc-linux-gnu (64-bit)

R is free software and comes with ABSOLUTELY NO WARRANTY.
You are welcome to redistribute it under certain conditions.
Type 'license()' or 'licence()' for distribution details.

R is a collaborative project with many contributors.
Type 'contributors()' for more information and
'citation()' on how to cite R or R packages in publications.

Type 'demo()' for some demos, 'help()' for on-line help, or
'help.start()' for an HTML browser interface to help.
Type 'q()' to quit R.

> library(XDE)
Loading required package: Biobase
Loading required package: BiocGenerics
Loading required package: parallel

Attaching package: 'BiocGenerics'

The following objects are masked from 'package:parallel':

    clusterApply, clusterApplyLB, clusterCall, clusterEvalQ,
    clusterExport, clusterMap, parApply, parCapply, parLapply,
    parLapplyLB, parRapply, parSapply, parSapplyLB

The following objects are masked from 'package:stats':

    IQR, mad, xtabs

The following objects are masked from 'package:base':

    Filter, Find, Map, Position, Reduce, anyDuplicated, append,
    as.data.frame, cbind, colnames, do.call, duplicated, eval, evalq,
    get, grep, grepl, intersect, is.unsorted, lapply, lengths, mapply,
    match, mget, order, paste, pmax, pmax.int, pmin, pmin.int, rank,
    rbind, rownames, sapply, setdiff, sort, table, tapply, union,
    unique, unsplit

Welcome to Bioconductor

    Vignettes contain introductory material; view with
    'browseVignettes()'. To cite Bioconductor, see
    'citation("Biobase")', and for packages 'citation("pkgname")'.

Welcome to XDE version 2.18.0
> png(filename="/home/ddbj/snapshot/RGM3/R_BC/result/XDE/symbolsInteresting.Rd_%03d_medium.png", width=480, height=480)
> ### Name: symbolsInteresting
> ### Title: Useful for changing the look of pairs plots to emphasize
> ###   concordant or discordant genes
> ### Aliases: symbolsInteresting
> ### Keywords: dplot
>
> ### ** Examples
>
>
>   data(expressionSetList)
>   data(xmcmc)
>   pathToLogFiles <- system.file("logFiles", package="XDE")
>   load(file.path(pathToLogFiles, "BES.rda"))
>   load(file.path(pathToLogFiles, "postAvg.rda"))
>   op.conc <- symbolsInteresting(rankingStatistic=postAvg[, "concordant"])
>   graphics:::pairs(BES[op.conc$order, ], pch=op.conc$pch, col=op.conc$col,
+                    bg=op.conc$bg, upper.panel=NULL, cex=op.conc$cex)
>
>
>
>
>
>
> dev.off()
null device
          1
>
 .
.