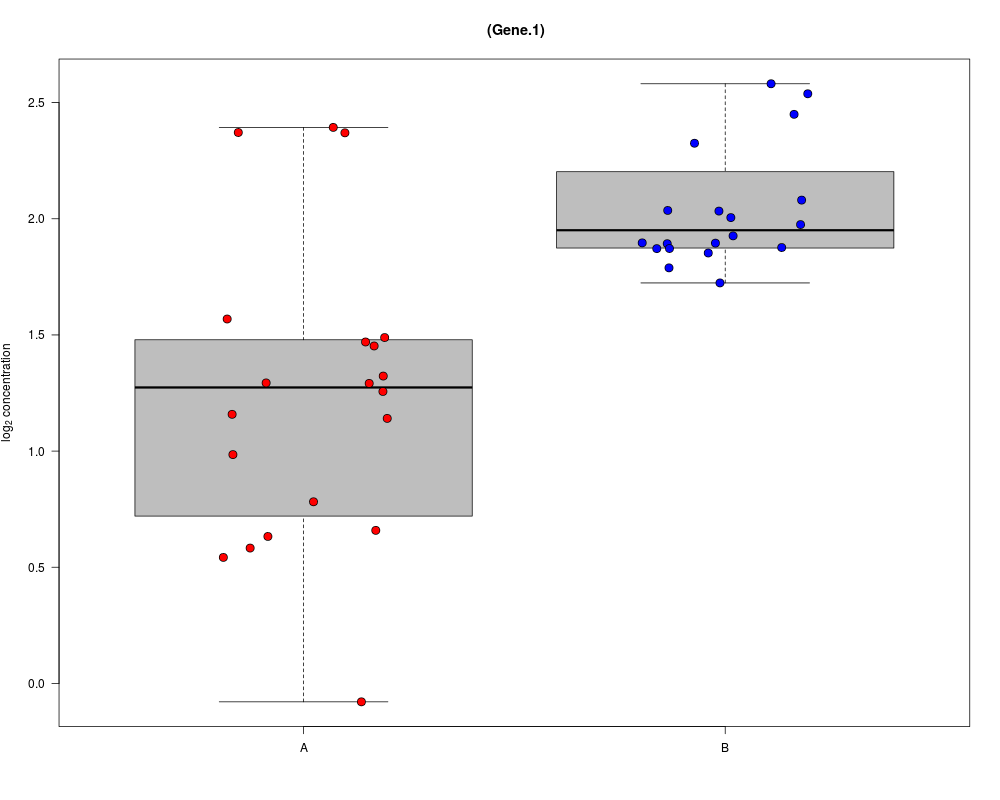
Create a boxplot for a given gene. The boxplot displays the expression values (y-axis)
by groupss (x-axis). The raw data are superimposed as dots, jittered for readability of the plot.
Optionally, the dots can be colored by another variable.
The probeset ID. These should be stored in the featureNames
of the expressionSet object.
geneSymbol
The gene symbol. These should be stored in the column `Gene Symbol`
in the featureData of the expressionSet object.
object
ExpressionSet object for the experiment
groups
String containing the name of the grouping variable. This should be a
the name of a column in the pData of the expressionSet object.
main
Main title on top of the graph
colvec
Vector of colors to be used for the groups. If not specified, the default colors of
a4palette are used.
colgroups
String containing the name of the variable to color the superimposed dots.
This should be a the name of a column in the pData of the expressionSet object.
probe2gene
Boolean indicating whether the probeset should be translated to a gene symbol
(used for the default title of the plot)
addLegend
Boolean indicating whether a legend for the colors of the dots should be added.
legendPos
Specify where the legend should be placed. Typically either topright,
bottomright, topleft (the default) or bottomleft
...
Possibility to add extra plot options. See par
Author(s)
Willem Talloen
See Also
plot1gene
Examples
# simulated data set
esSim <- simulateData()
boxPlot(probesetId = 'Gene.1', object = esSim, groups = 'type', addLegend = FALSE)
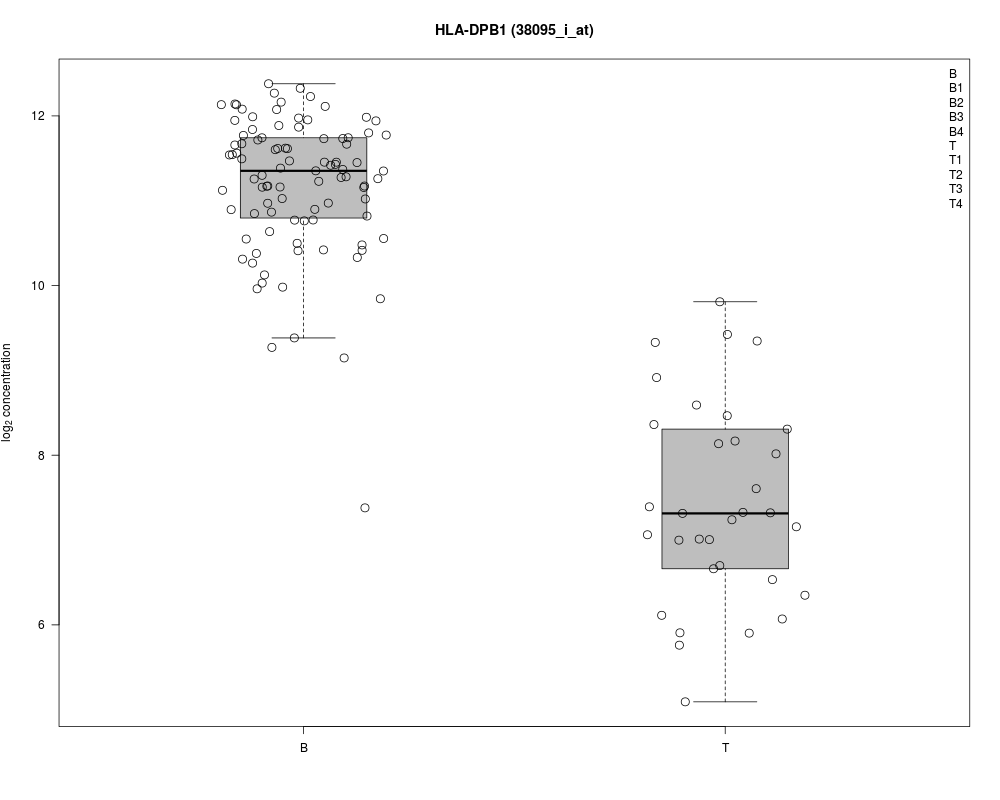
# ALL data set
if (require(ALL)){
data(ALL, package = "ALL")
ALL <- addGeneInfo(ALL)
ALL$BTtype <- as.factor(substr(ALL$BT,0,1))
boxPlot(geneSymbol = 'HLA-DPB1', object = ALL, boxwex = 0.3,
groups = 'BTtype', colgroups = 'BT', legendPos='topright')
}
Results
R version 3.3.1 (2016-06-21) -- "Bug in Your Hair"
Copyright (C) 2016 The R Foundation for Statistical Computing
Platform: x86_64-pc-linux-gnu (64-bit)

R is free software and comes with ABSOLUTELY NO WARRANTY.
You are welcome to redistribute it under certain conditions.
Type 'license()' or 'licence()' for distribution details.

R is a collaborative project with many contributors.
Type 'contributors()' for more information and
'citation()' on how to cite R or R packages in publications.

Type 'demo()' for some demos, 'help()' for on-line help, or
'help.start()' for an HTML browser interface to help.
Type 'q()' to quit R.

> library(a4Base)
Loading required package: grid
Loading required package: Biobase
Loading required package: BiocGenerics
Loading required package: parallel

Attaching package: 'BiocGenerics'

The following objects are masked from 'package:parallel':

    clusterApply, clusterApplyLB, clusterCall, clusterEvalQ,
    clusterExport, clusterMap, parApply, parCapply, parLapply,
    parLapplyLB, parRapply, parSapply, parSapplyLB

The following objects are masked from 'package:stats':

    IQR, mad, xtabs

The following objects are masked from 'package:base':

    Filter, Find, Map, Position, Reduce, anyDuplicated, append,
    as.data.frame, cbind, colnames, do.call, duplicated, eval, evalq,
    get, grep, grepl, intersect, is.unsorted, lapply, lengths, mapply,
    match, mget, order, paste, pmax, pmax.int, pmin, pmin.int, rank,
    rbind, rownames, sapply, setdiff, sort, table, tapply, union,
    unique, unsplit

Welcome to Bioconductor

    Vignettes contain introductory material; view with
    'browseVignettes()'. To cite Bioconductor, see
    'citation("Biobase")', and for packages 'citation("pkgname")'.

Loading required package: AnnotationDbi
Loading required package: stats4
Loading required package: IRanges
Loading required package: S4Vectors

Attaching package: 'S4Vectors'

The following objects are masked from 'package:base':

    colMeans, colSums, expand.grid, rowMeans, rowSums

Loading required package: annaffy
Loading required package: GO.db

Loading required package: KEGG.db

KEGG.db contains mappings based on older data because the original
  resource was removed from the the public domain before the most
  recent update was produced. This package should now be considered
  deprecated and future versions of Bioconductor may not have it
  available.  Users who want more current data are encouraged to look
  at the KEGGREST or reactome.db packages

Loading required package: mpm
Loading required package: MASS

Attaching package: 'MASS'

The following object is masked from 'package:AnnotationDbi':

    select

Loading required package: KernSmooth
KernSmooth 2.23 loaded
Copyright M. P. Wand 1997-2009

mpm version 1.0-22

Loading required package: genefilter

Attaching package: 'genefilter'

The following object is masked from 'package:MASS':

    area

Loading required package: limma

Attaching package: 'limma'

The following object is masked from 'package:BiocGenerics':

    plotMA

Loading required package: multtest
Loading required package: glmnet
Loading required package: Matrix

Attaching package: 'Matrix'

The following object is masked from 'package:S4Vectors':

    expand

Loading required package: foreach
Loaded glmnet 2.0-5

Loading required package: a4Preproc
Loading required package: a4Core

Attaching package: 'a4Core'

The following object is masked from 'package:limma':

    topTable

Loading required package: gplots

Attaching package: 'gplots'

The following object is masked from 'package:multtest':

    wapply

The following object is masked from 'package:IRanges':

    space

The following object is masked from 'package:S4Vectors':

    space

The following object is masked from 'package:stats':

    lowess


a4Base version 1.20.0

> png(filename="/home/ddbj/snapshot/RGM3/R_BC/result/a4Base/boxPlot.Rd_%03d_medium.png", width=480, height=480)
> ### Name: boxPlot
> ### Title: Create a boxplot for a given gene.
> ### Aliases: boxPlot
>
> ### ** Examples
>
> # simulated data set
> esSim <- simulateData()
> boxPlot(probesetId = 'Gene.1', object = esSim, groups = 'type', addLegend = FALSE)
>
> # ALL data set
> if (require(ALL)){
+   data(ALL, package = "ALL")
+   ALL <- addGeneInfo(ALL)
+   ALL$BTtype <- as.factor(substr(ALL$BT,0,1))
+
+   boxPlot(geneSymbol = 'HLA-DPB1', object = ALL, boxwex = 0.3,
+ 		  groups = 'BTtype', colgroups = 'BT', legendPos='topright')
+ }
Loading required package: ALL
Loading required package: hgu95av2.db
Loading required package: org.Hs.eg.db


Warning message:
In boxPlot(geneSymbol = "HLA-DPB1", object = ALL, boxwex = 0.3,  :
  Gene HLA-DPB1 corresponds to 2 probesets; only the first probeset ( 38095_i_at ) has been displayed on the plot.
>
>
>
>
>
> dev.off()
null device
          1
>
 .
.