Supported by Dr. Osamu Ogasawara and  . . |
|
Last data update: 2014.03.03 |
Draw a Spectral MapDescriptionGeneric function to draw a spectral map. UsagespectralMap(object, groups, ...) Arguments
ValueObject of class NoteColoring of groups on the spectralMap uses the a4 palette as produced
by Author(s)Tobias Verbeke ReferencesWouters, L., Goehlmann, H., Bijnens, L., Kass, S.U., Molenberghs, G., Lewi, P.J. (2003). Graphical exploration of gene expression data: a comparative study of three multivariate methods. Biometrics 59, 1131-1140. Goehlmann, H. and W. Talloen (2009). Gene Expression Studies Using Affymetrix Microarrays, Chapman & Hall/CRC, pp. 148 - 153. See Also
Examples
if (require(ALL)){
data(ALL, package = "ALL")
ALL <- addGeneInfo(ALL)
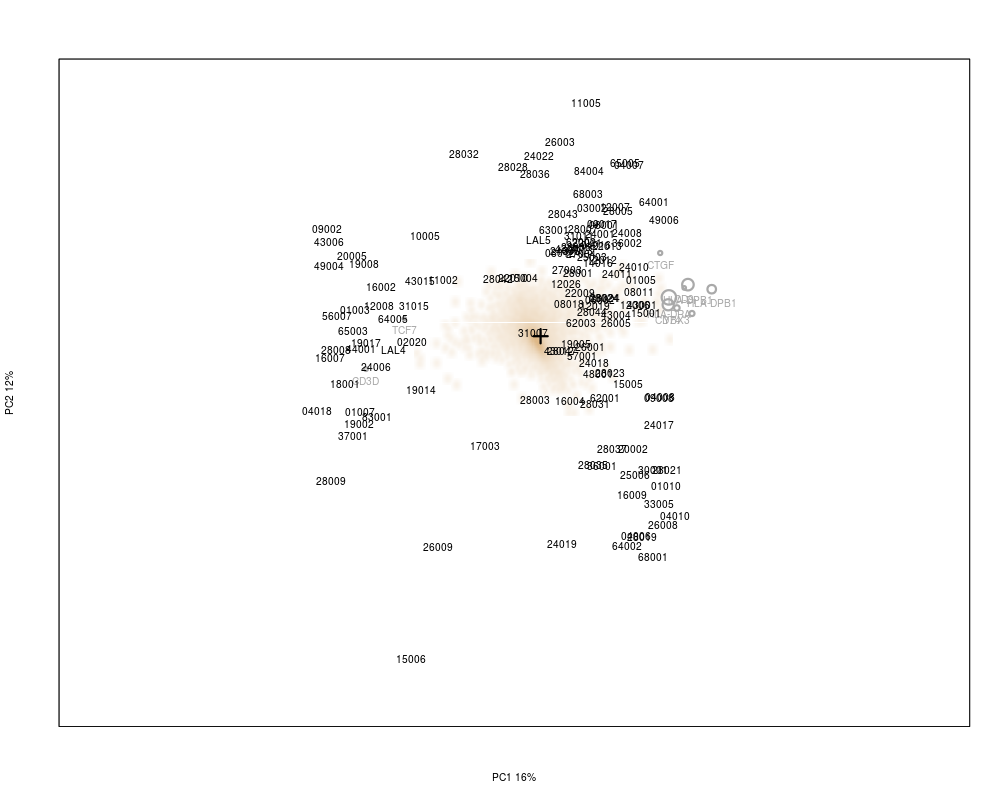
spectralMap(object = ALL, groups = "BT", legendPos = 'bottomright')
spectralMap(object = ALL, groups = "BT",
plot.mpm.args = list(label.tol = 10, rot = c(-1, 1), sub = "", lab.size = 0.65,
dim = c(1,2), sampleNames = FALSE, zoom = c(1,5), col.size = 2,
do.smoothScatter = TRUE))
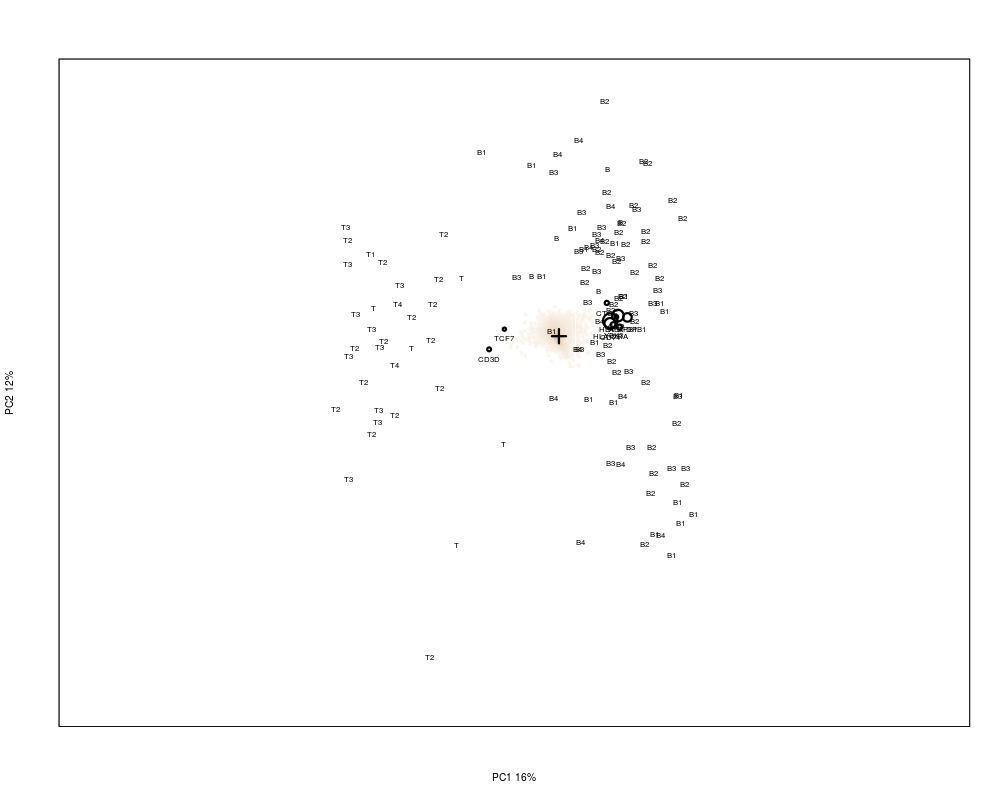
spectralMap(object = ALL, groups = "BT",
plot.mpm.args = list(label.tol = 10, rot = c(-1, 1), sub = "", lab.size = 0.65,
dim = c(1,2), sampleNames = as.character(pData(ALL)$BT),
zoom = c(1,5), col.size = 2, do.smoothScatter = TRUE))
}
Results
R version 3.3.1 (2016-06-21) -- "Bug in Your Hair"
Copyright (C) 2016 The R Foundation for Statistical Computing
Platform: x86_64-pc-linux-gnu (64-bit)

R is free software and comes with ABSOLUTELY NO WARRANTY.
You are welcome to redistribute it under certain conditions.
Type 'license()' or 'licence()' for distribution details.

R is a collaborative project with many contributors.
Type 'contributors()' for more information and
'citation()' on how to cite R or R packages in publications.

Type 'demo()' for some demos, 'help()' for on-line help, or
'help.start()' for an HTML browser interface to help.
Type 'q()' to quit R.

> library(a4Base)
Loading required package: grid
Loading required package: Biobase
Loading required package: BiocGenerics
Loading required package: parallel

Attaching package: 'BiocGenerics'

The following objects are masked from 'package:parallel':

    clusterApply, clusterApplyLB, clusterCall, clusterEvalQ,
    clusterExport, clusterMap, parApply, parCapply, parLapply,
    parLapplyLB, parRapply, parSapply, parSapplyLB

The following objects are masked from 'package:stats':

    IQR, mad, xtabs

The following objects are masked from 'package:base':

    Filter, Find, Map, Position, Reduce, anyDuplicated, append,
    as.data.frame, cbind, colnames, do.call, duplicated, eval, evalq,
    get, grep, grepl, intersect, is.unsorted, lapply, lengths, mapply,
    match, mget, order, paste, pmax, pmax.int, pmin, pmin.int, rank,
    rbind, rownames, sapply, setdiff, sort, table, tapply, union,
    unique, unsplit

Welcome to Bioconductor

    Vignettes contain introductory material; view with
    'browseVignettes()'. To cite Bioconductor, see
    'citation("Biobase")', and for packages 'citation("pkgname")'.

Loading required package: AnnotationDbi
Loading required package: stats4
Loading required package: IRanges
Loading required package: S4Vectors

Attaching package: 'S4Vectors'

The following objects are masked from 'package:base':

    colMeans, colSums, expand.grid, rowMeans, rowSums

Loading required package: annaffy
Loading required package: GO.db

Loading required package: KEGG.db

KEGG.db contains mappings based on older data because the original
  resource was removed from the the public domain before the most
  recent update was produced. This package should now be considered
  deprecated and future versions of Bioconductor may not have it
  available.  Users who want more current data are encouraged to look
  at the KEGGREST or reactome.db packages

Loading required package: mpm
Loading required package: MASS

Attaching package: 'MASS'

The following object is masked from 'package:AnnotationDbi':

    select

Loading required package: KernSmooth
KernSmooth 2.23 loaded
Copyright M. P. Wand 1997-2009

mpm version 1.0-22

Loading required package: genefilter

Attaching package: 'genefilter'

The following object is masked from 'package:MASS':

    area

Loading required package: limma

Attaching package: 'limma'

The following object is masked from 'package:BiocGenerics':

    plotMA

Loading required package: multtest
Loading required package: glmnet
Loading required package: Matrix

Attaching package: 'Matrix'

The following object is masked from 'package:S4Vectors':

    expand

Loading required package: foreach
Loaded glmnet 2.0-5

Loading required package: a4Preproc
Loading required package: a4Core

Attaching package: 'a4Core'

The following object is masked from 'package:limma':

    topTable

Loading required package: gplots

Attaching package: 'gplots'

The following object is masked from 'package:multtest':

    wapply

The following object is masked from 'package:IRanges':

    space

The following object is masked from 'package:S4Vectors':

    space

The following object is masked from 'package:stats':

    lowess


a4Base version 1.20.0

> png(filename="/home/ddbj/snapshot/RGM3/R_BC/result/a4Base/spectralMap.Rd_%03d_medium.png", width=480, height=480)
> ### Name: spectralMap
> ### Title: Draw a Spectral Map
> ### Aliases: spectralMap
> ### Keywords: hplot
>
> ### ** Examples
>
> if (require(ALL)){
+   data(ALL, package = "ALL")
+   ALL <- addGeneInfo(ALL)
+
+   spectralMap(object = ALL, groups = "BT", legendPos = 'bottomright')
+
+   spectralMap(object = ALL, groups = "BT",
+       plot.mpm.args = list(label.tol = 10, rot = c(-1, 1), sub = "", lab.size = 0.65,
+ 	    dim = c(1,2), sampleNames = FALSE, zoom = c(1,5), col.size = 2,
+ 	    do.smoothScatter = TRUE))
+
+   spectralMap(object = ALL, groups = "BT",
+ 	  plot.mpm.args = list(label.tol = 10, rot = c(-1, 1), sub = "", lab.size = 0.65,
+ 	      dim = c(1,2), sampleNames = as.character(pData(ALL)$BT),
+           zoom = c(1,5), col.size = 2, do.smoothScatter = TRUE))
+ }
Loading required package: ALL
Loading required package: hgu95av2.db
Loading required package: org.Hs.eg.db


>
>
>
>
>
> dev.off()
null device
          1
>
|