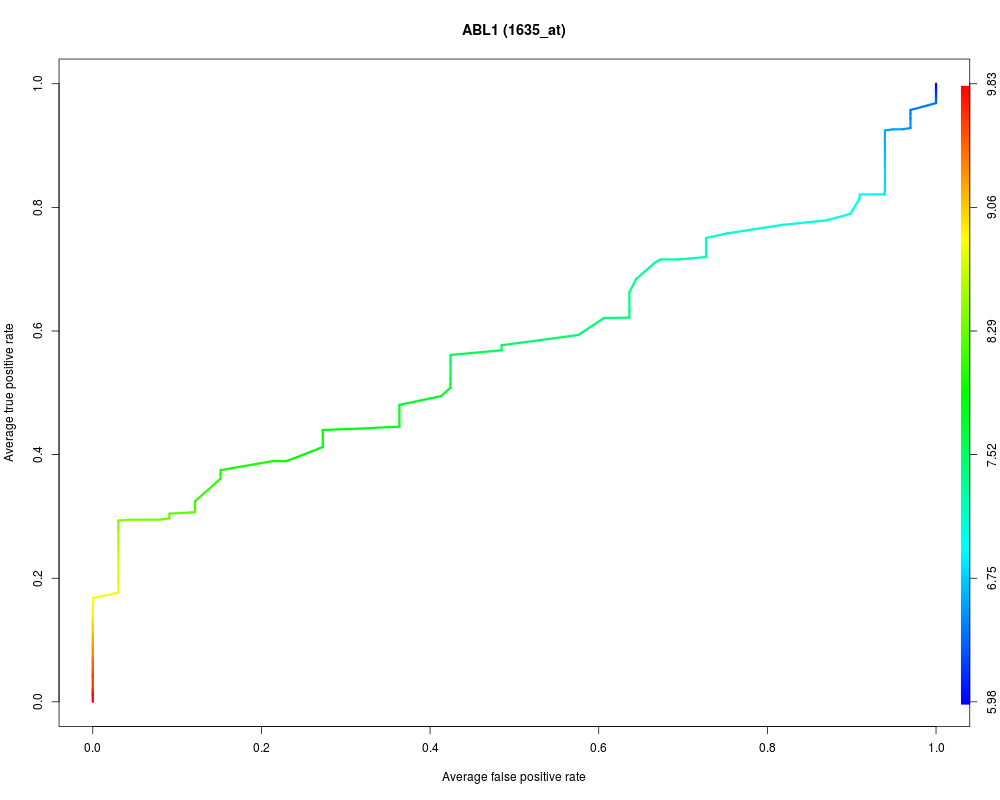
A ROC curve plots the fraction of true positives (TPR = true positive rate)
versus the fraction of false positives (FPR = false positive rate) for a binary classifier
when the discrimination threshold is varied. Equivalently, one can also plot
sensitivity versus (1 - specificity).
# simulated data set
esSim <- simulateData()
ROCcurve(probesetId = 'Gene.1', object = esSim, groups = 'type', addLegend = FALSE)

# ALL data set
if (require(ALL)){
  data(ALL, package = "ALL")
  ALL <- addGeneInfo(ALL)
  ALL$BTtype <- as.factor(substr(ALL$BT,0,1))
  ROCres <- ROCcurve(gene = "ABL1", object = ALL, groups = "BTtype")
}
Results
R version 3.3.1 (2016-06-21) -- "Bug in Your Hair"
Copyright (C) 2016 The R Foundation for Statistical Computing
Platform: x86_64-pc-linux-gnu (64-bit)

R is free software and comes with ABSOLUTELY NO WARRANTY.
You are welcome to redistribute it under certain conditions.
Type 'license()' or 'licence()' for distribution details.

R is a collaborative project with many contributors.
Type 'contributors()' for more information and
'citation()' on how to cite R or R packages in publications.

Type 'demo()' for some demos, 'help()' for on-line help, or
'help.start()' for an HTML browser interface to help.
Type 'q()' to quit R.

> library(a4Classif)
Loading required package: a4Core
Loading required package: Biobase
Loading required package: BiocGenerics
Loading required package: parallel

Attaching package: 'BiocGenerics'

The following objects are masked from 'package:parallel':

    clusterApply, clusterApplyLB, clusterCall, clusterEvalQ,
    clusterExport, clusterMap, parApply, parCapply, parLapply,
    parLapplyLB, parRapply, parSapply, parSapplyLB

The following objects are masked from 'package:stats':

    IQR, mad, xtabs

The following objects are masked from 'package:base':

    Filter, Find, Map, Position, Reduce, anyDuplicated, append,
    as.data.frame, cbind, colnames, do.call, duplicated, eval, evalq,
    get, grep, grepl, intersect, is.unsorted, lapply, lengths, mapply,
    match, mget, order, paste, pmax, pmax.int, pmin, pmin.int, rank,
    rbind, rownames, sapply, setdiff, sort, table, tapply, union,
    unique, unsplit

Welcome to Bioconductor

    Vignettes contain introductory material; view with
    'browseVignettes()'. To cite Bioconductor, see
    'citation("Biobase")', and for packages 'citation("pkgname")'.

Loading required package: glmnet
Loading required package: Matrix
Loading required package: foreach
Loaded glmnet 2.0-5

Loading required package: a4Preproc
Loading required package: AnnotationDbi
Loading required package: stats4
Loading required package: IRanges
Loading required package: S4Vectors

Attaching package: 'S4Vectors'

The following objects are masked from 'package:Matrix':

    colMeans, colSums, expand, rowMeans, rowSums

The following objects are masked from 'package:base':

    colMeans, colSums, expand.grid, rowMeans, rowSums

Loading required package: MLInterfaces
Loading required package: annotate
Loading required package: XML
Loading required package: cluster
Loading required package: ROCR
Loading required package: gplots

Attaching package: 'gplots'

The following object is masked from 'package:IRanges':

    space

The following object is masked from 'package:S4Vectors':

    space

The following object is masked from 'package:stats':

    lowess

Loading required package: pamr
Loading required package: survival
Loading required package: varSelRF
Loading required package: randomForest
randomForest 4.6-12
Type rfNews() to see new features/changes/bug fixes.

Attaching package: 'randomForest'

The following object is masked from 'package:Biobase':

    combine

The following object is masked from 'package:BiocGenerics':

    combine


a4Classif version 1.20.0

> png(filename="/home/ddbj/snapshot/RGM3/R_BC/result/a4Classif/ROCcurve.Rd_%03d_medium.png", width=480, height=480)
> ### Name: ROCcurve
> ### Title: Receiver operating curve
> ### Aliases: ROCcurve
>
> ### ** Examples
>
> # simulated data set
> esSim <- simulateData()
> ROCcurve(probesetId = 'Gene.1', object = esSim, groups = 'type', addLegend = FALSE)
>
> # ALL data set
> if (require(ALL)){
+   data(ALL, package = "ALL")
+   ALL <- addGeneInfo(ALL)
+   ALL$BTtype <- as.factor(substr(ALL$BT,0,1))
+   ROCres <- ROCcurve(gene = "ABL1", object = ALL, groups = "BTtype")
+ }
Loading required package: ALL
Loading required package: hgu95av2.db
Loading required package: org.Hs.eg.db


Warning message:
In ROCcurve(gene = "ABL1", object = ALL, groups = "BTtype") :
  Gene ABL1 corresponds to 6 probesets; only the first probeset ( 1635_at ) has been displayed on the plot.
>
>
>
>
>
> dev.off()
null device
          1
>
 .
.