Supported by Dr. Osamu Ogasawara and  . . |
|
Last data update: 2014.03.03 |
Class aCGHDescriptionObjects of this class represent batch of arrays of Comparative Genomic Hybridization data. In addition to that, there are slots for representing phenotype and various genomic events associated with aCGH experiments, such as transitions, amplifications, aberrations, and whole chromosomal gains and losses. Currently objects of class aCGH are represented as S3 classes which are named list of lists with functions for accessing elements of that list. In the future, it's anticipated that aCGH objects will be implemented using S4 classes and methods. DetailsOne way of creating objects of class aCGH is to provide the two
mandatory arguments to Value
Most of the functions/slots listed above have assignment operators '<-' associated with them. Note
Author(s)Peter Dimitrov See Also
Examples
## Creating aCGH object from log2.ratios and clone info files
## For alternative way look at aCGH.read.Sprocs help
datadir <- system.file(package = "aCGH")
datadir <- paste(datadir, "/examples", sep="")
clones.info <-
read.table(file = file.path(datadir, "clones.info.ex.txt"),
header = TRUE, sep = "\t", quote="", comment.char="")
log2.ratios <-
read.table(file = file.path(datadir, "log2.ratios.ex.txt"),
header = TRUE, sep = "\t", quote="", comment.char="")
pheno.type <-
read.table(file = file.path(datadir, "pheno.type.ex.txt"),
header = TRUE, sep = "\t", quote="", comment.char="")
ex.acgh <- create.aCGH(log2.ratios, clones.info, pheno.type)
## Printing, summary and basic plotting for objects of class aCGH
data(colorectal)
colorectal
summary(colorectal)
sample.names(colorectal)
phenotype(colorectal)
plot(colorectal)
## Subsetting aCGH object
colorectal[1:1000, 1:30]
## Imputing the log2 ratios
log2.ratios.imputed(ex.acgh) <- impute.lowess(ex.acgh)
## Determining hmm states of the clones
## WARNING: Calculating the states takes some time
##in the interests of time, hmm-finding function is commented out
##instead the states previosuly save are assigned
##hmm(ex.acgh) <- find.hmm.states(ex.acgh)
hmm(ex.acgh) <- ex.acgh.hmm
hmm.merged(ex.acgh) <-
mergeHmmStates(ex.acgh, model.use = 1, minDiff = .25)
## Calculating the standard deviations for each array
sd.samples(ex.acgh) <- computeSD.Samples(ex.acgh)
## Finding the genomic events associated with each sample
genomic.events(ex.acgh) <- find.genomic.events(ex.acgh)
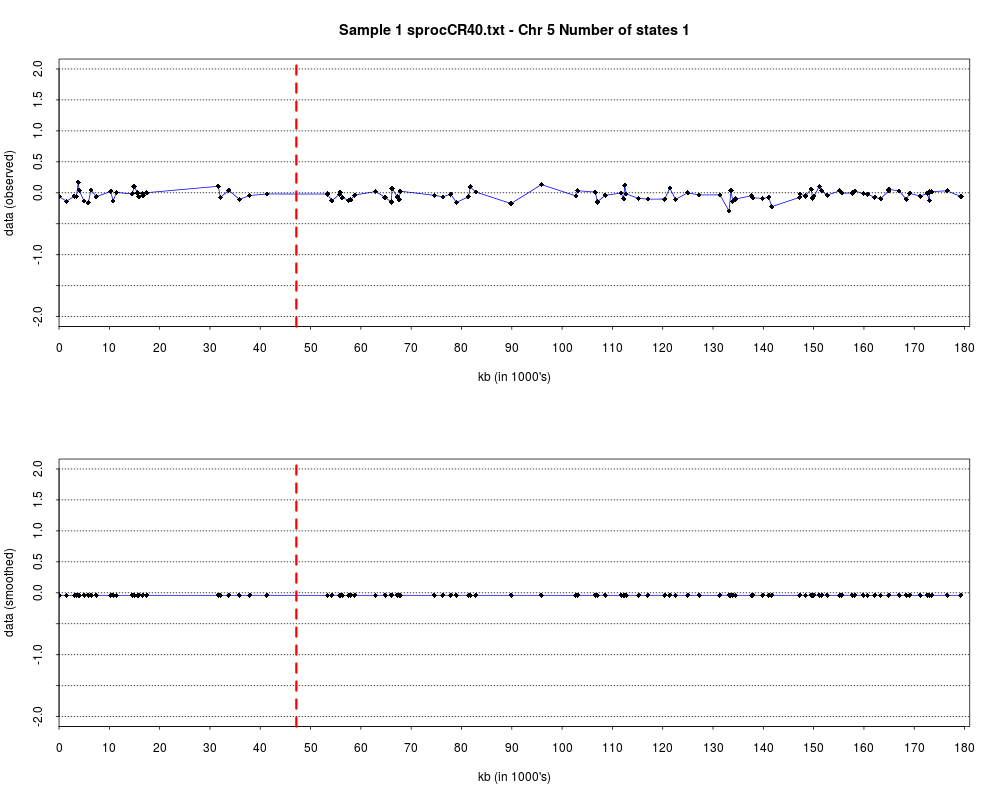
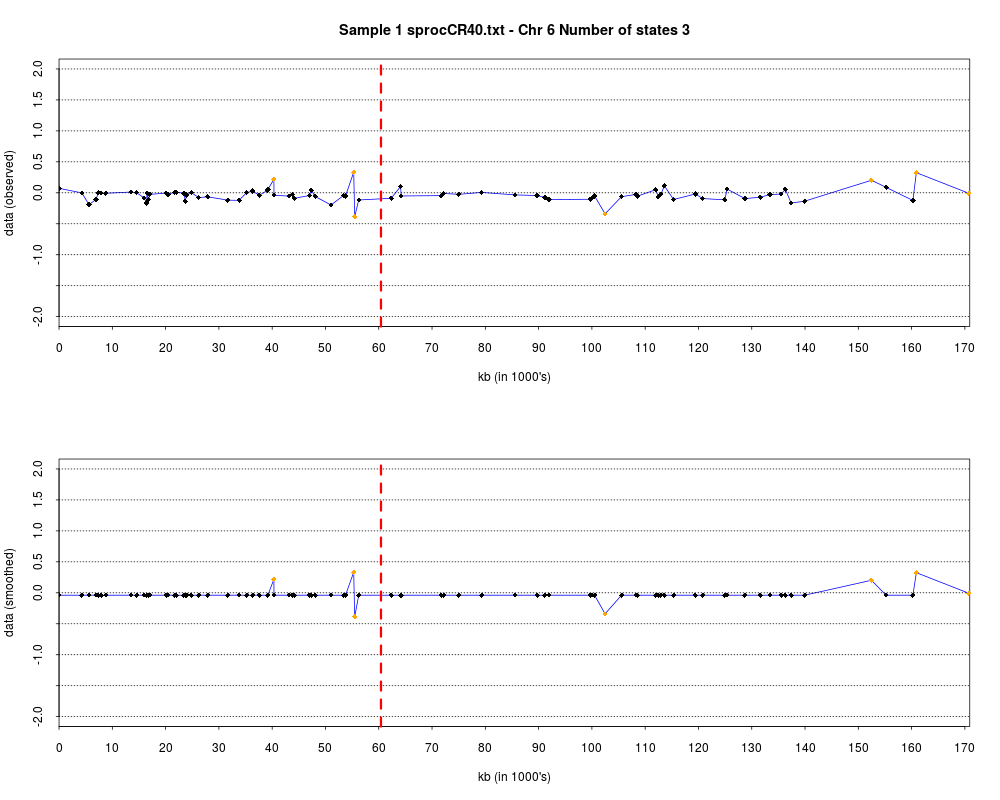
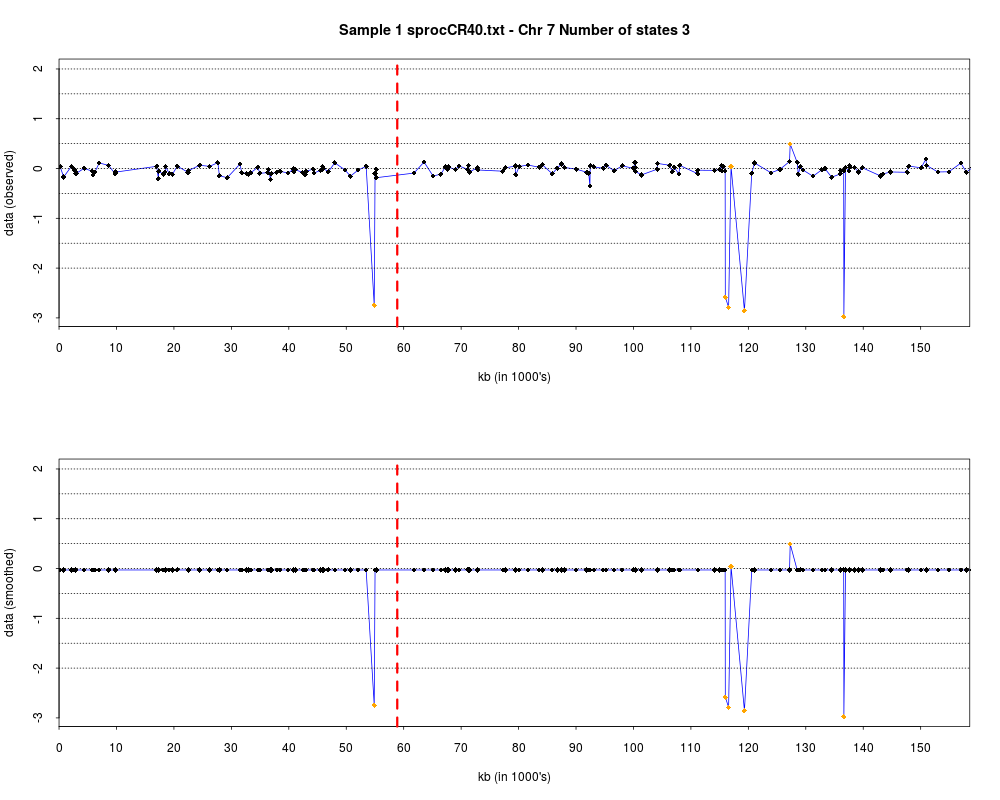
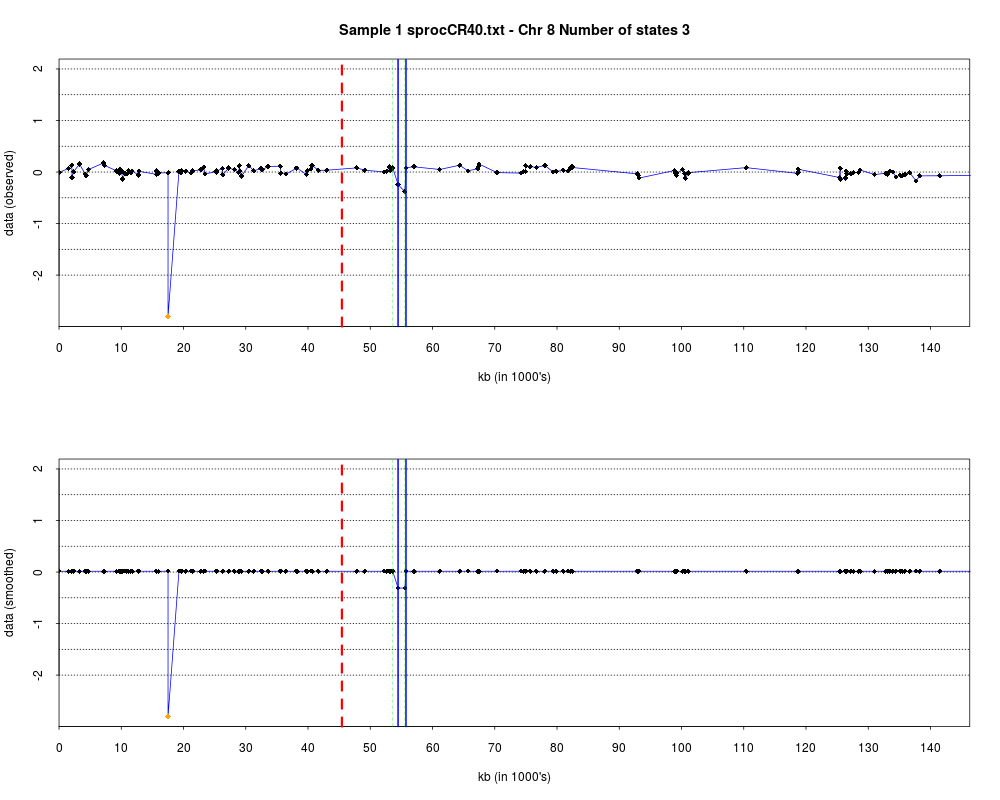
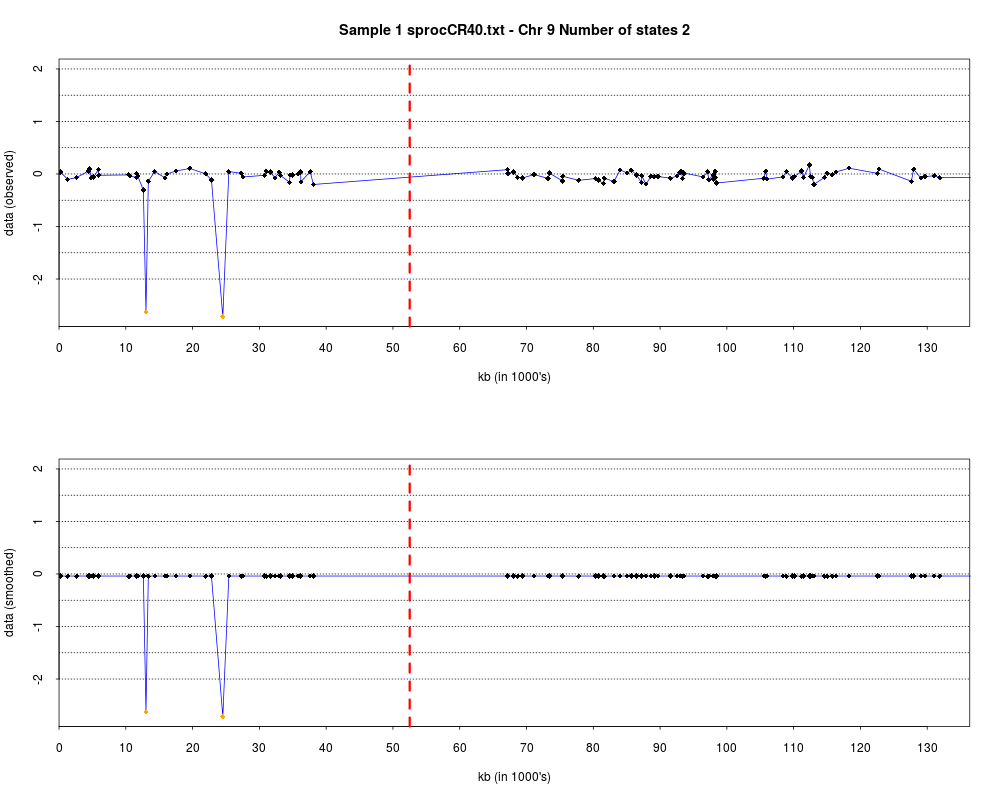
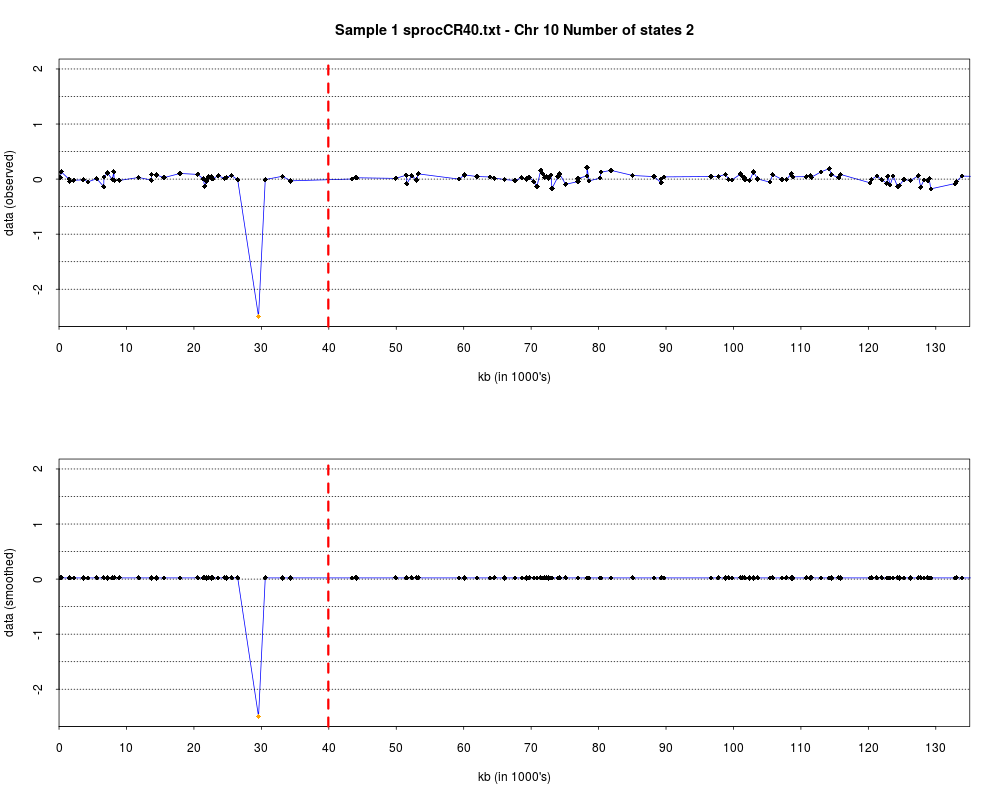
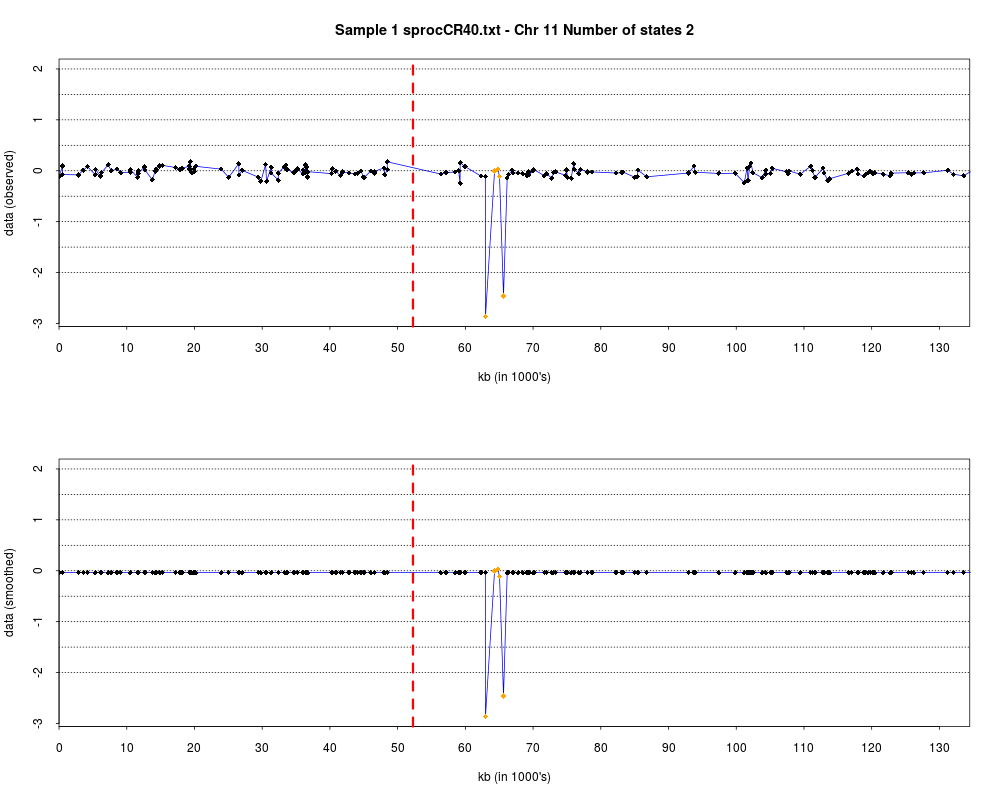
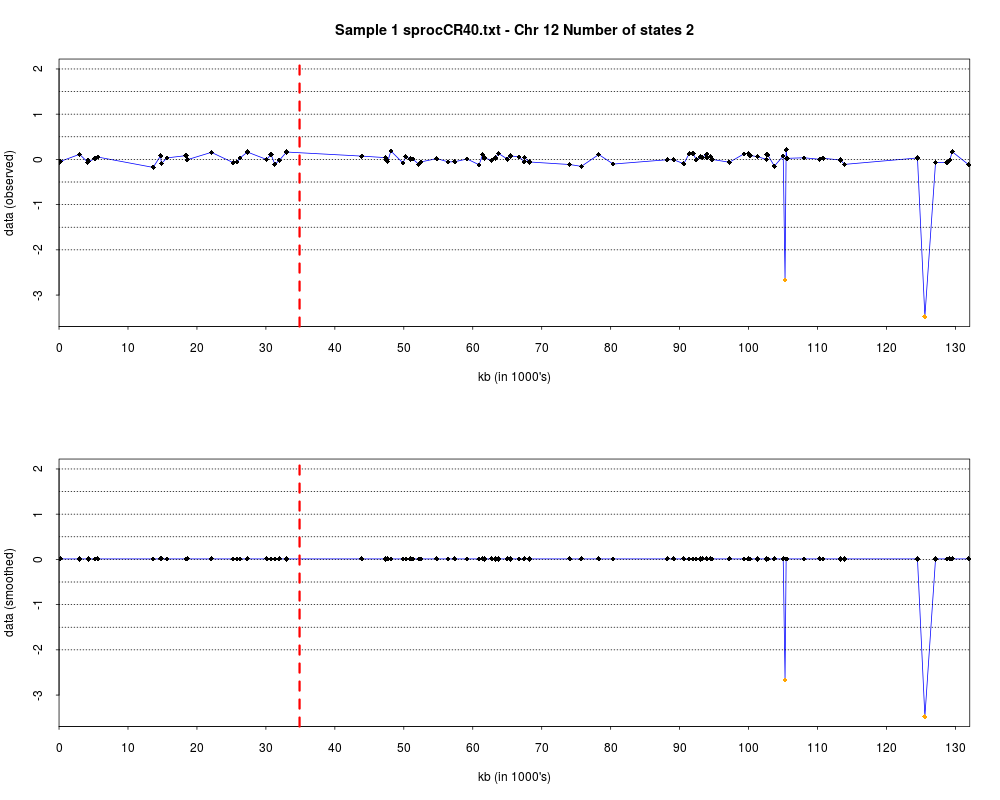
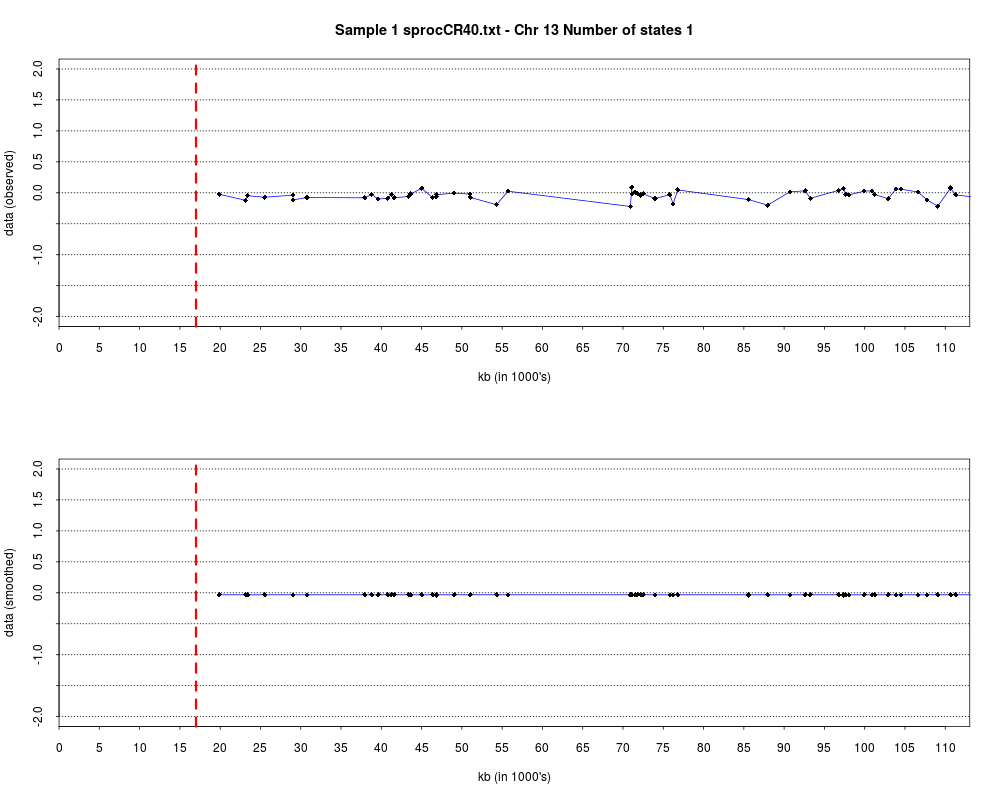
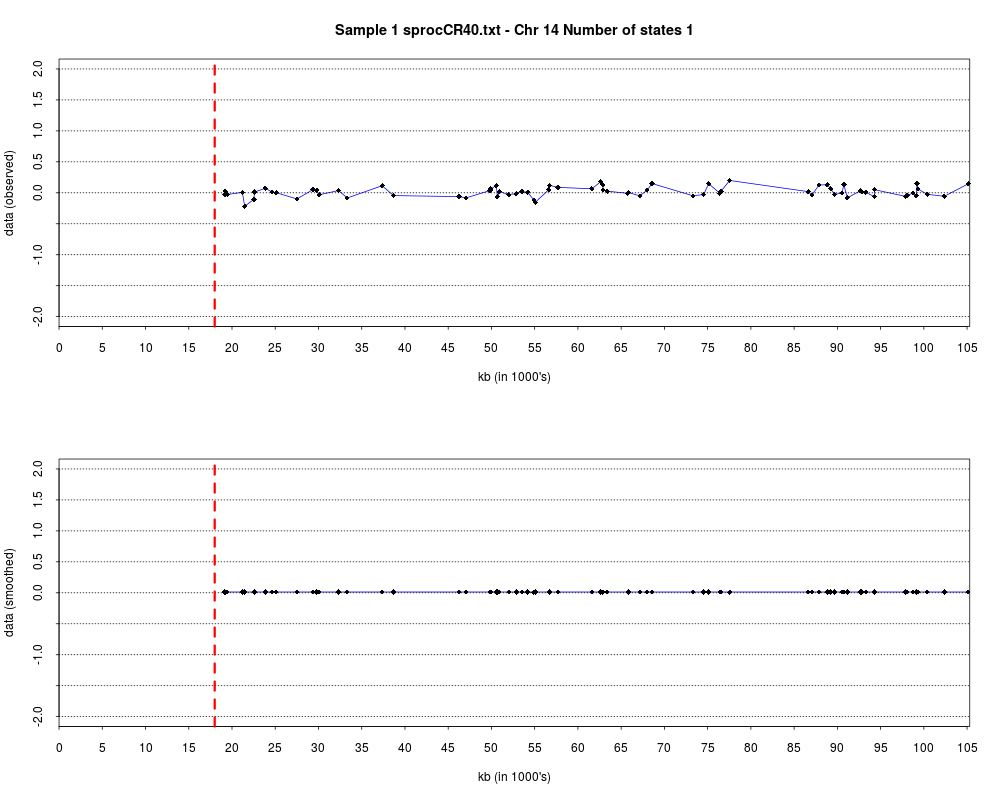
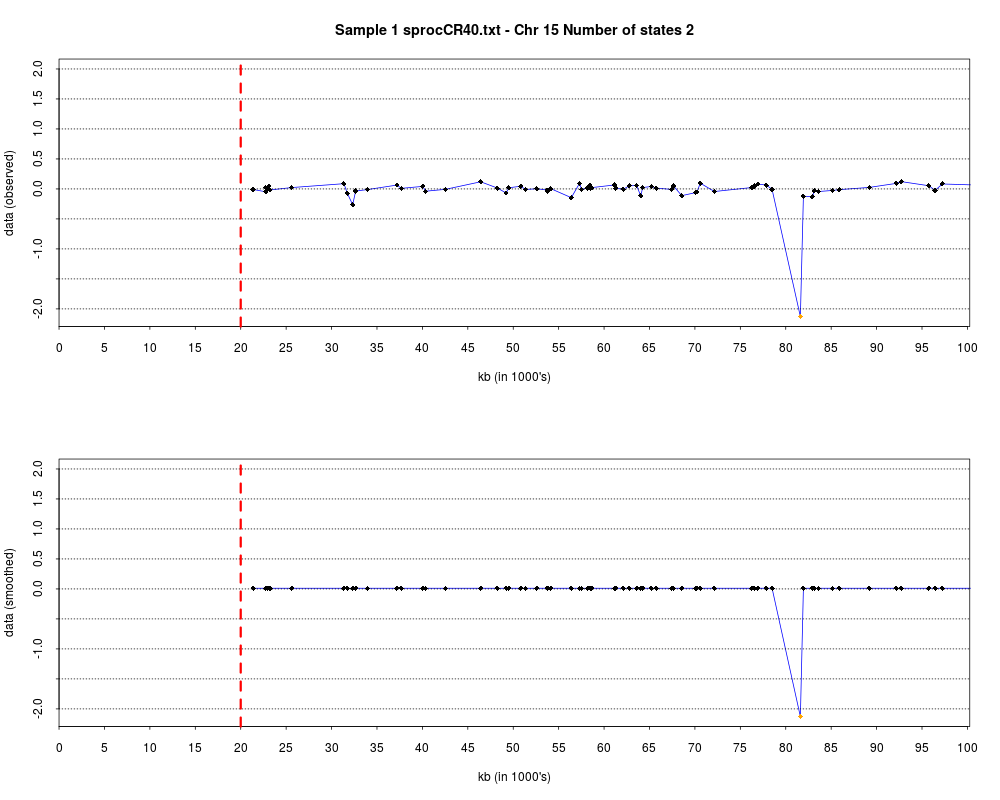
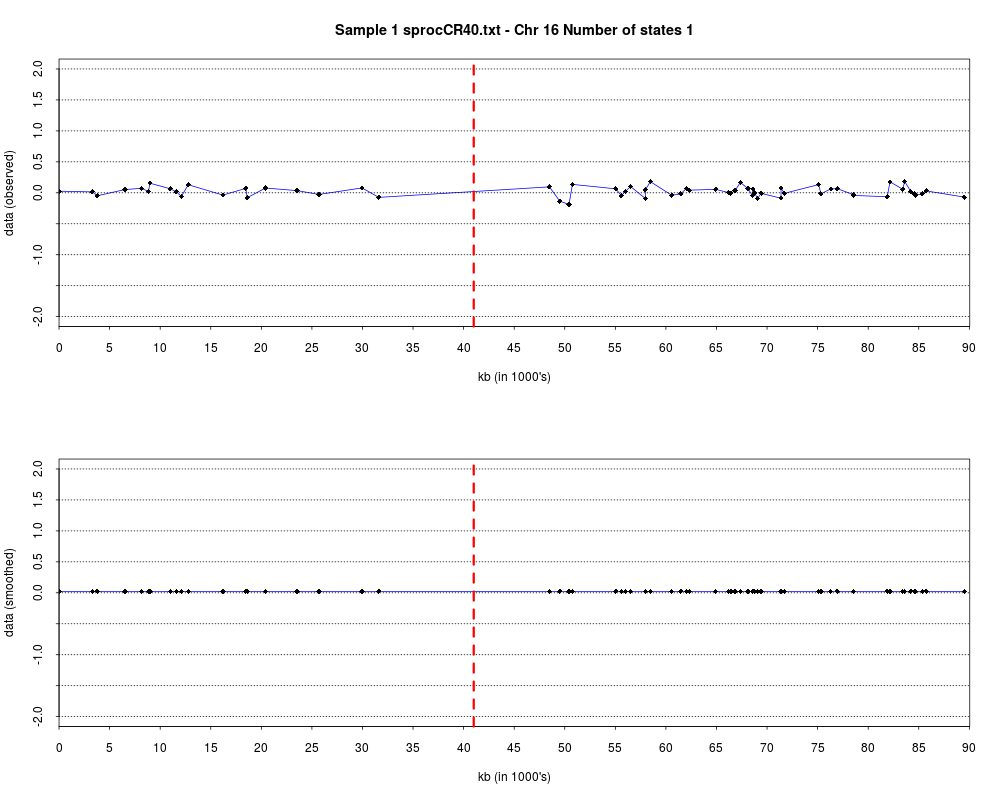
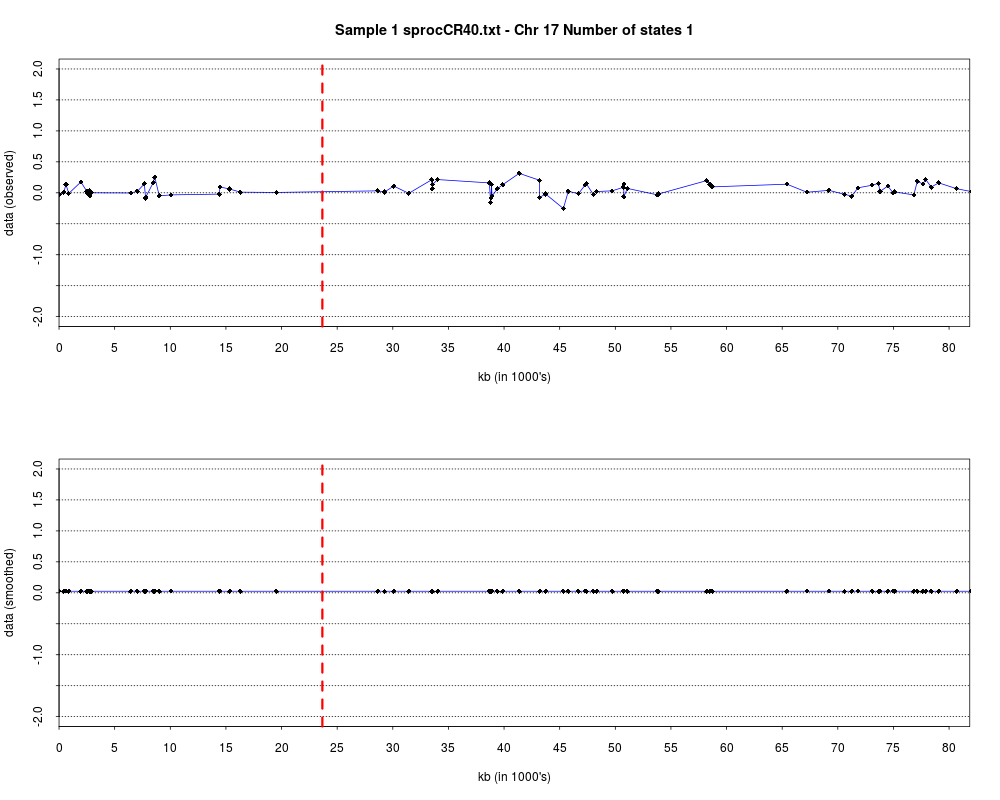
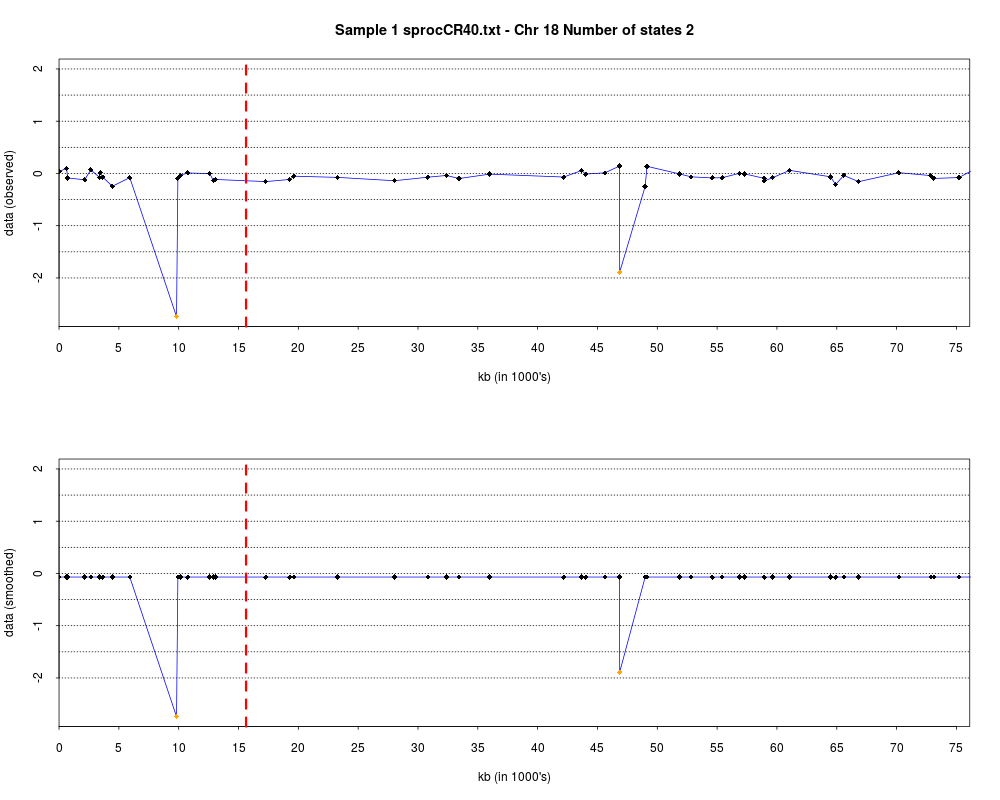
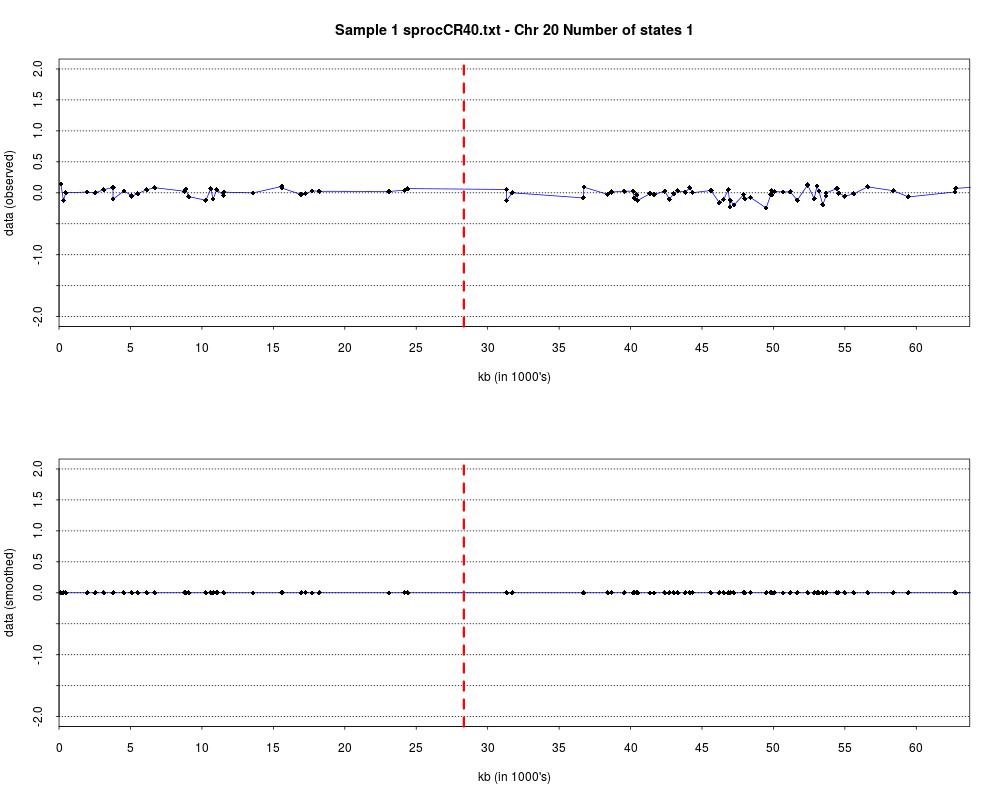
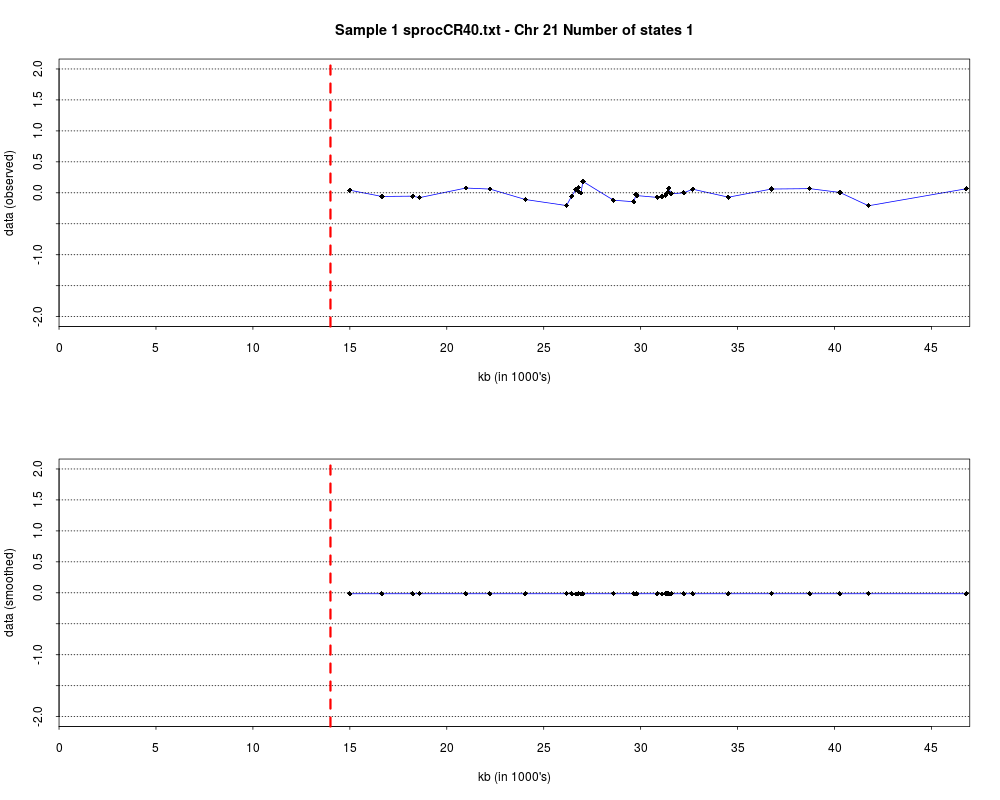
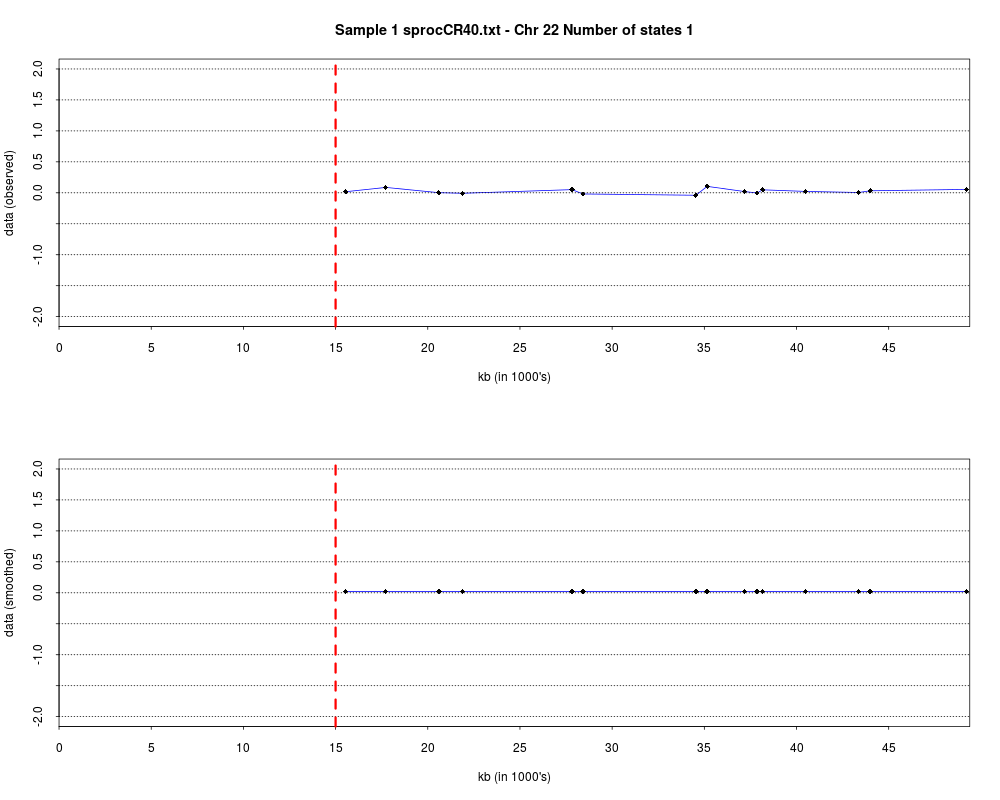
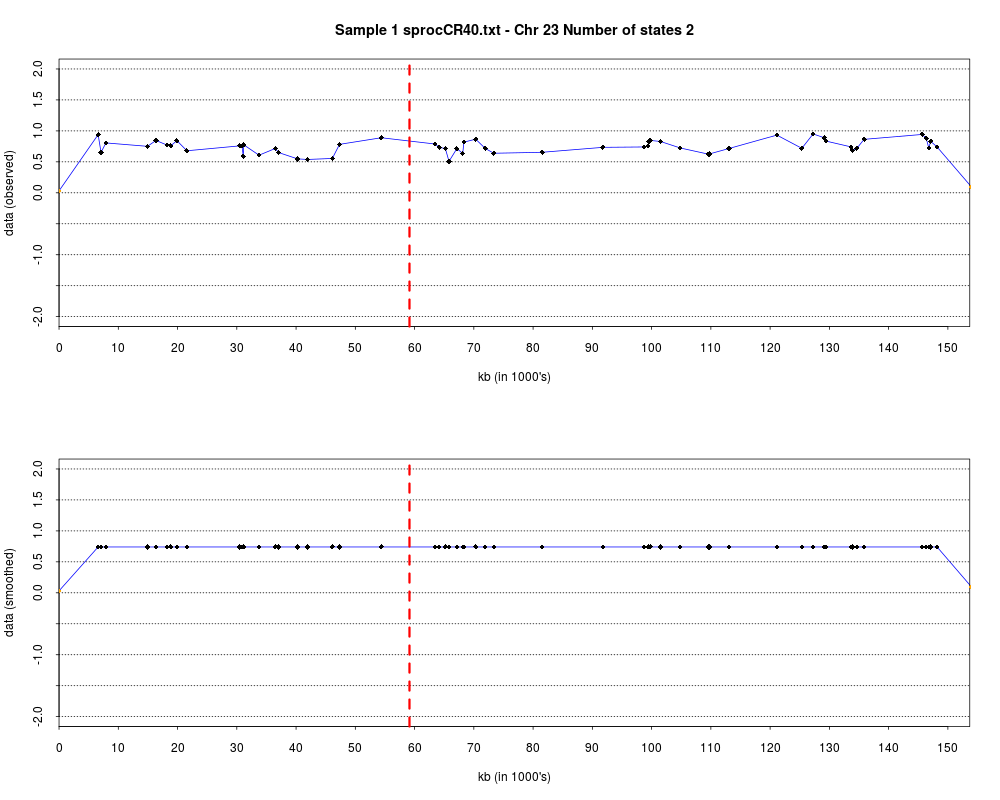
## Plotting and printing the hmm states
plotHmmStates(ex.acgh, 1)
pdf("hmm.states.temp.pdf")
plotHmmStates(ex.acgh, 1)
dev.off()
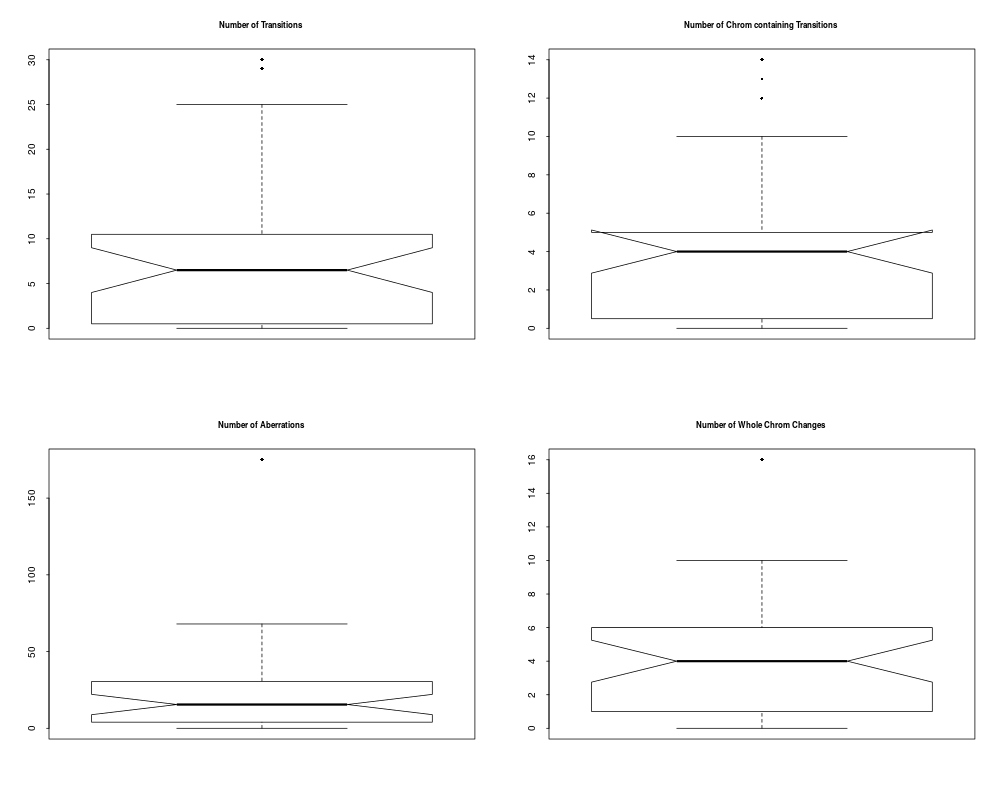
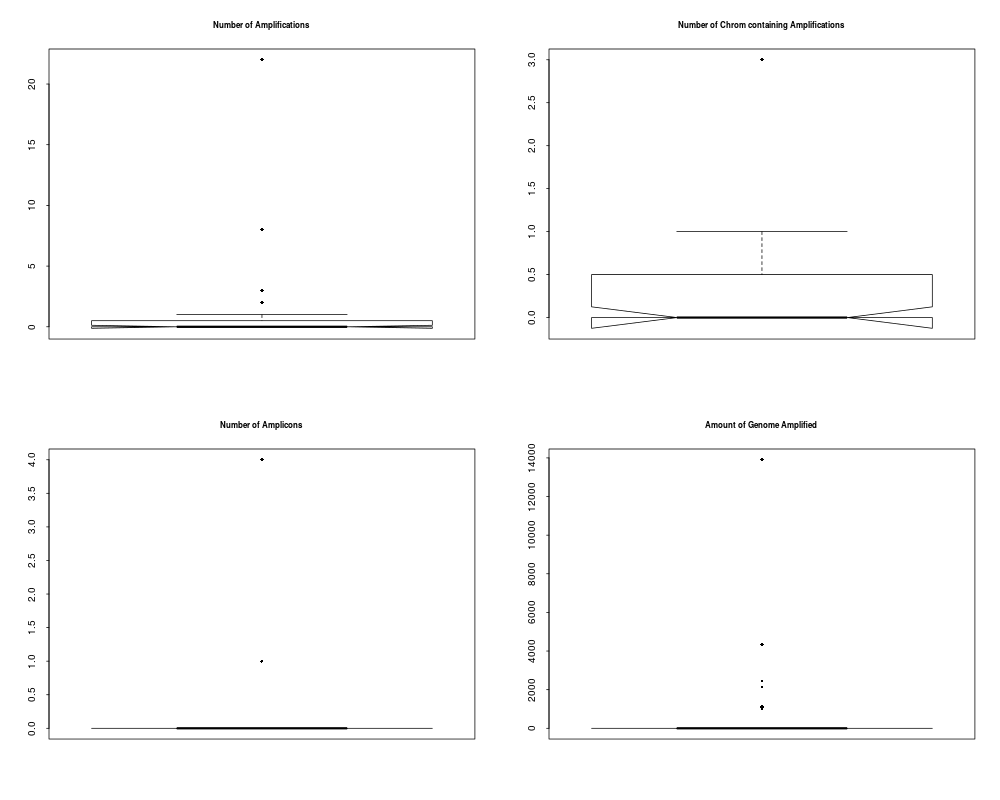
## Plotting summary of the sample profiles
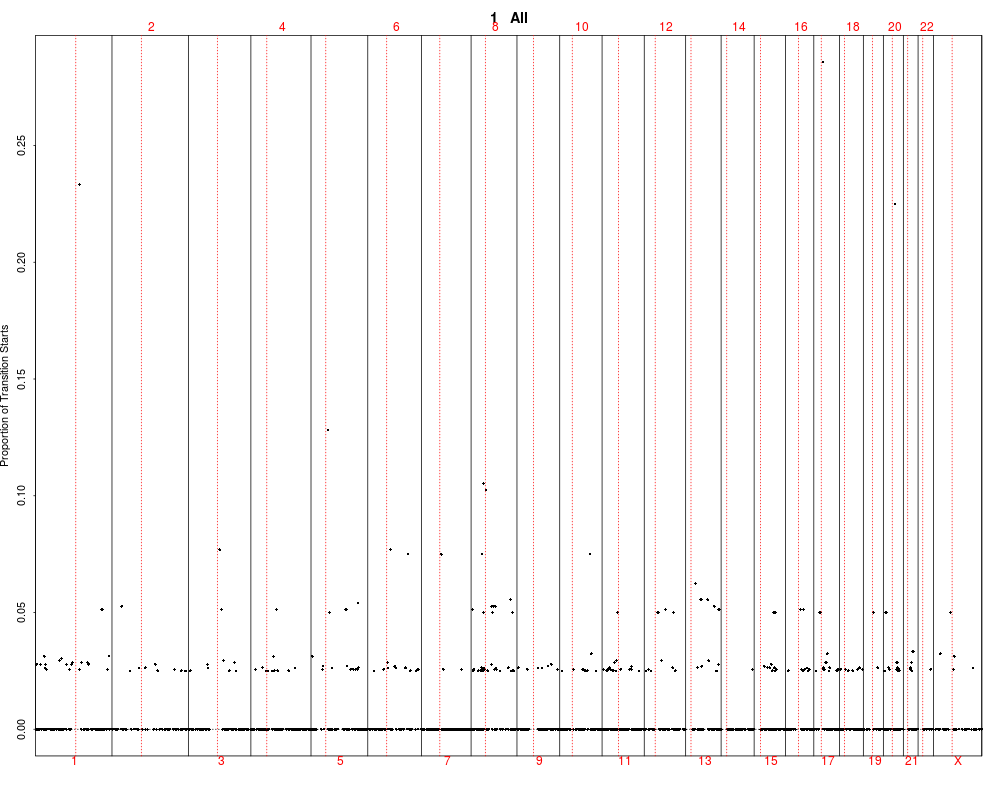
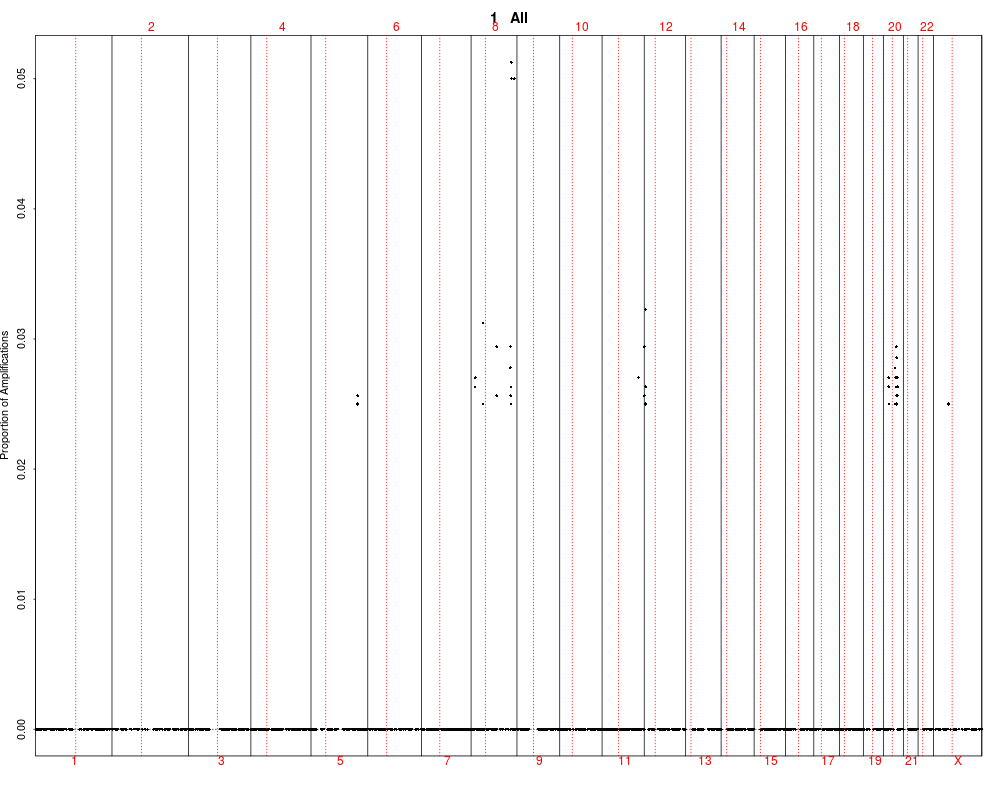
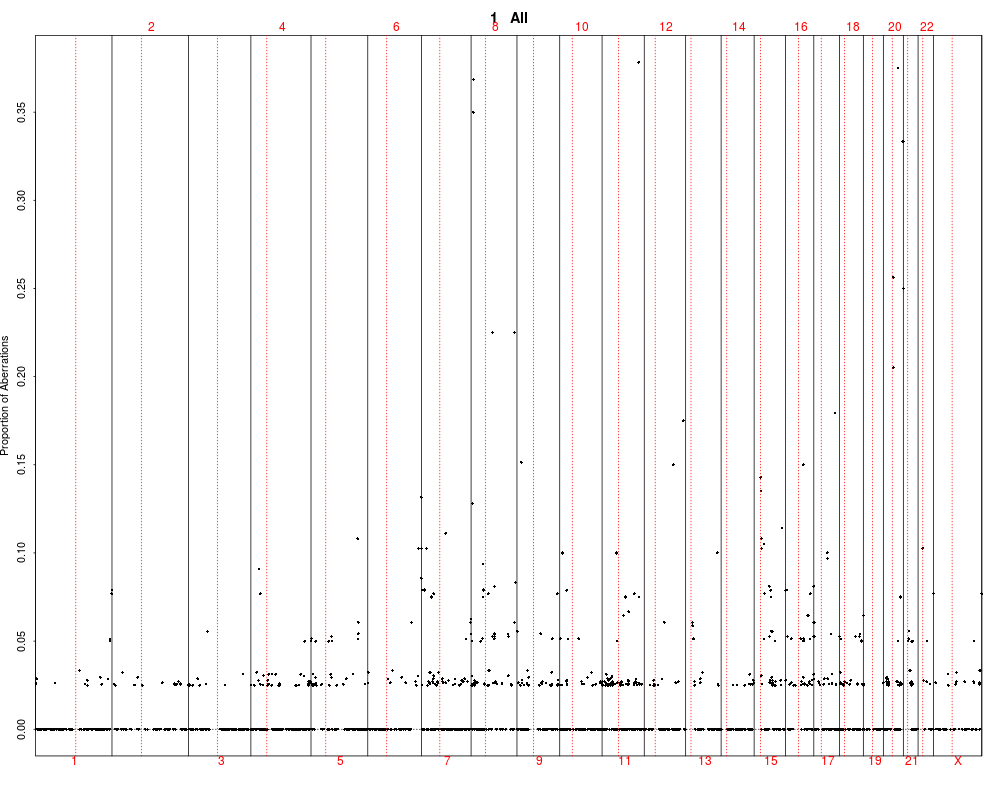
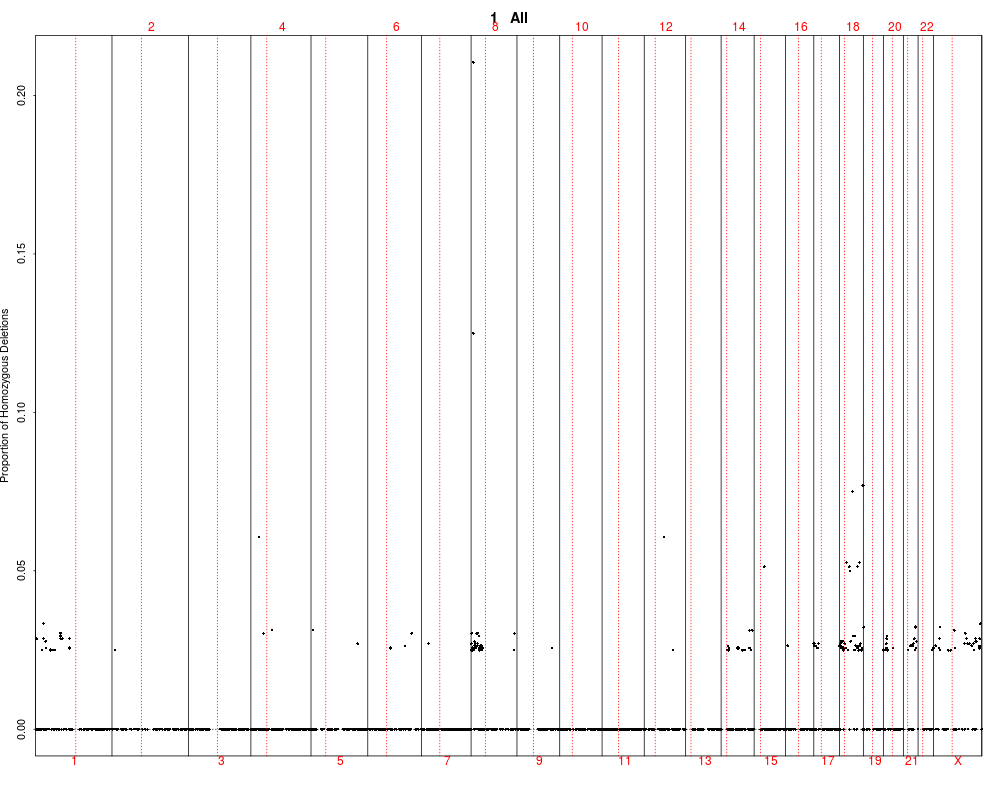
plotSummaryProfile(colorectal)
Results
R version 3.3.1 (2016-06-21) -- "Bug in Your Hair"
Copyright (C) 2016 The R Foundation for Statistical Computing
Platform: x86_64-pc-linux-gnu (64-bit)
R is free software and comes with ABSOLUTELY NO WARRANTY.
You are welcome to redistribute it under certain conditions.
Type 'license()' or 'licence()' for distribution details.
R is a collaborative project with many contributors.
Type 'contributors()' for more information and
'citation()' on how to cite R or R packages in publications.
Type 'demo()' for some demos, 'help()' for on-line help, or
'help.start()' for an HTML browser interface to help.
Type 'q()' to quit R.
> library(aCGH)
Loading required package: cluster
Loading required package: survival
Loading required package: multtest
Loading required package: BiocGenerics
Loading required package: parallel
Attaching package: 'BiocGenerics'
The following objects are masked from 'package:parallel':
clusterApply, clusterApplyLB, clusterCall, clusterEvalQ,
clusterExport, clusterMap, parApply, parCapply, parLapply,
parLapplyLB, parRapply, parSapply, parSapplyLB
The following objects are masked from 'package:stats':
IQR, mad, xtabs
The following objects are masked from 'package:base':
Filter, Find, Map, Position, Reduce, anyDuplicated, append,
as.data.frame, cbind, colnames, do.call, duplicated, eval, evalq,
get, grep, grepl, intersect, is.unsorted, lapply, lengths, mapply,
match, mget, order, paste, pmax, pmax.int, pmin, pmin.int, rank,
rbind, rownames, sapply, setdiff, sort, table, tapply, union,
unique, unsplit
Loading required package: Biobase
Welcome to Bioconductor
Vignettes contain introductory material; view with
'browseVignettes()'. To cite Bioconductor, see
'citation("Biobase")', and for packages 'citation("pkgname")'.
Attaching package: 'aCGH'
The following object is masked from 'package:stats':
heatmap
> png(filename="/home/ddbj/snapshot/RGM3/R_BC/result/aCGH/aCGH.Rd_%03d_medium.png", width=480, height=480)
> ### Name: aCGH
> ### Title: Class aCGH
> ### Aliases: aCGH create.aCGH log2.ratios clones.info is.aCGH dim.aCGH
> ### num.clones nrow.aCGH num.samples num.chromosomes ncol.aCGH
> ### clone.names row.names.aCGH rownames.aCGH clone.names<-
> ### row.names<-.aCGH rownames<-.aCGH col.names.aCGH col.names<-.aCGH
> ### colnames.aCGH colnames<-.aCGH sample.names sample.names<-
> ### log2.ratios.imputed log2.ratios.imputed<- hmm hmm<- hmm.merged
> ### hmm.merged<- sd.samples sd.samples<- genomic.events genomic.events<-
> ### phenotype phenotype<- [.aCGH print.aCGH summary.aCGH plot.aCGH minna
> ### maxna corna floorFunc lengthNumFunc propNumFunc subset.hmm
> ### subset.hmm.merged ex.acgh.hmm is.odd is.even
> ### Keywords: classes
>
> ### ** Examples
>
>
> ## Creating aCGH object from log2.ratios and clone info files
> ## For alternative way look at aCGH.read.Sprocs help
>
> datadir <- system.file(package = "aCGH")
> datadir <- paste(datadir, "/examples", sep="")
>
> clones.info <-
+ read.table(file = file.path(datadir, "clones.info.ex.txt"),
+ header = TRUE, sep = "\t", quote="", comment.char="")
> log2.ratios <-
+ read.table(file = file.path(datadir, "log2.ratios.ex.txt"),
+ header = TRUE, sep = "\t", quote="", comment.char="")
> pheno.type <-
+ read.table(file = file.path(datadir, "pheno.type.ex.txt"),
+ header = TRUE, sep = "\t", quote="", comment.char="")
> ex.acgh <- create.aCGH(log2.ratios, clones.info, pheno.type)
>
> ## Printing, summary and basic plotting for objects of class aCGH
>
> data(colorectal)
> colorectal
aCGH object
Call: aCGH.read.Sprocs(sproclist[1:40], "human.clones.info.Jul03.csv",
chrom.remove.threshold = 23)
Number of Arrays 40
Number of Clones 2031
> summary(colorectal)
aCGH object
Call: aCGH.read.Sprocs(sproclist[1:40], "human.clones.info.Jul03.csv",
chrom.remove.threshold = 23)
Number of Arrays 40
Number of Clones 2031
Imputed data exist
HMM states assigned
samples standard deviations are computed
genomic events are assigned
phenotype exists
> sample.names(colorectal)
[1] "sprocCR31.txt" "sprocCR40.txt" "sprocCR43.txt" "sprocCR59.txt"
[5] "sprocCR63.txt" "sprocCR73.txt" "sprocCR75.txt" "sprocCR77.txt"
[9] "sprocCR96.txt" "sprocCR98.txt" "sprocCR100.txt" "sprocCR106.txt"
[13] "sprocCR112.txt" "sprocCR122.txt" "sprocCR124.txt" "sprocCR131.txt"
[17] "sprocCR135.txt" "sprocCR137.txt" "sprocCR146.txt" "sprocCR148.txt"
[21] "sprocCR150.txt" "sprocCR154.txt" "sprocCR159.txt" "sprocCR163.txt"
[25] "sprocCR169.txt" "sprocCR178.txt" "sprocCR180.txt" "sprocCR186.txt"
[29] "sprocCR193.txt" "sprocCR200.txt" "sprocCR204.txt" "sprocCR210.txt"
[33] "sprocCR212.txt" "sprocCR217.txt" "sprocCR219.txt" "sprocCR227.txt"
[37] "sprocCR232.txt" "sprocCR244.txt" "sprocCR246.txt" "sprocCR248.txt"
> phenotype(colorectal)
id age sex stage loc hist diff gstm1 gstt1 nqo K12 K13 MTHFR
1 31 70 0 1 0 Adenocarcinoma 1 0 1 1 1 2 2
2 40 71 0 1 1 Adenocarcinoma 1 1 1 1 2 2 2
3 43 59 1 1 0 Adenocarcinoma NA 1 1 1 2 2 2
4 59 72 0 2 1 Adenocarcinoma 1 1 1 1 2 2 1
5 63 65 1 3 1 Adenocarcinoma 1 0 1 1 2 2 2
6 73 66 0 1 1 Adenocarcinoma 1 1 0 0 1 2 2
7 75 87 0 1 0 Adenocarcinoma 1 0 1 0 1 2 3
8 77 73 0 1 2 Adenocarcinoma 1 0 1 1 2 2 2
9 96 62 0 2 0 Adenocarcinoma 1 1 1 1 1 2 2
10 98 69 1 0 1 Adenocarcinoma 1 0 1 1 2 2 2
11 100 75 0 2 2 Adenocarcinoma 0 0 1 1 2 1 1
12 106 70 1 1 1 Adenocarcinoma 1 0 1 1 2 1 3
13 112 69 0 1 1 Adenocarcinoma 1 1 1 1 2 2 3
14 122 72 0 3 1 Adenocarcinoma 1 0 1 1 1 2 1
15 124 81 1 3 0 Adenocarcinoma 0 1 0 1 2 2 2
16 131 62 0 1 1 Adenocarcinoma 1 0 1 1 2 1 3
17 135 65 1 2 1 Adenocarcinoma 1 0 1 1 2 2 2
18 137 60 1 3 0 Adenocarcinoma 1 0 0 1 1 2 1
19 146 64 1 2 1 Adenocarcinoma 1 1 1 1 2 1 2
20 148 85 0 2 2 Adenocarcinoma 1 1 1 1 2 2 2
21 150 82 0 3 0 Adenocarcinoma 1 0 1 1 2 2 2
22 154 60 0 2 1 Adenocarcinoma 1 1 0 1 2 2 2
23 159 75 0 3 1 Adenocarcinoma 1 0 0 1 2 2 2
24 163 48 0 3 1 Adenocarcinoma 1 1 0 1 2 2 2
25 169 62 0 1 1 Adenocarcinoma 1 0 1 0 2 2 3
26 178 85 1 1 1 Adenocarcinoma 1 1 1 1 1 2 1
27 180 NA NA NA NA NA NA NA NA NA NA NA
28 186 74 0 2 0 Adenocarcinoma 1 1 1 1 2 2 1
29 193 78 0 3 0 Adenocarcinoma NA 0 1 1 2 2 2
30 200 75 1 2 1 Adenocarcinoma 1 1 0 1 2 2 2
31 204 86 1 2 0 Adenocarcinoma 0 0 0 1 2 2 1
32 210 66 1 1 2 Adenocarcinoma 1 1 0 1 1 2 2
33 212 81 1 3 0 Adenocarcinoma 0 1 1 0 2 2 1
34 217 89 0 1 0 Adenocarcinoma 1 0 1 1 2 2 1
35 219 76 1 2 0 Adenocarcinoma 1 1 1 1 2 2 3
36 227 77 0 2 1 Adenocarcinoma 1 1 1 1 2 2 3
37 232 45 1 3 2 Adenocarcinoma 1 0 1 1 2 2 2
38 244 83 0 1 1 Adenocarcinoma 1 1 1 1 2 2 2
39 246 59 1 1 2 Adenocarcinoma 1 0 1 1 2 2 1
40 248 87 0 1 0 Adenocarcinoma 1 0 1 1 1 2 1
ERCC1 bat26 bat25 D5S346 D17S250 D2S123 mi2
1 1 0 0 0 0 0 0/1 unstable loci
2 2 0 0 1 1 1 >2 loci unstable, (NCI def)
3 1 0 0 0 0 0 0/1 unstable loci
4 NA 0 0 0 0 0 0/1 unstable loci
5 NA 0 0 1 0 0 0/1 unstable loci
6 2 0 0 0 0 0 0/1 unstable loci
7 2 0 0 0 0 0 0/1 unstable loci
8 2 0 0 0 0 1 0/1 unstable loci
9 2 0 0 2 0 0 0/1 unstable loci
10 2 0 0 0 0 0 0/1 unstable loci
11 2 0 0 0 0 0 0/1 unstable loci
12 1 0 0 0 1 1 2 loci unstable, neither BAT-26
13 2 0 0 2 0 0 0/1 unstable loci
14 2 0 0 0 0 0 0/1 unstable loci
15 2 1 1 1 1 1 BAT-26 unstable
16 1 0 0 0 0 0 0/1 unstable loci
17 2 0 1 2 0 0 0/1 unstable loci
18 3 0 0 0 0 0 0/1 unstable loci
19 1 0 0 0 0 2 0/1 unstable loci
20 2 0 0 0 0 0 0/1 unstable loci
21 1 0 0 0 1 1 2 loci unstable, neither BAT-26
22 2 0 0 0 0 0 0/1 unstable loci
23 1 0 0 0 0 0 0/1 unstable loci
24 1 0 0 0 0 0 0/1 unstable loci
25 1 0 0 0 0 1 0/1 unstable loci
26 3 0 0 0 0 0 0/1 unstable loci
27 NA NA NA NA NA NA
28 2 0 0 0 0 0 0/1 unstable loci
29 1 0 NA NA NA NA 0/1 unstable loci
30 1 0 0 0 0 0 0/1 unstable loci
31 2 1 1 1 1 1 BAT-26 unstable
32 1 0 0 0 2 2 0/1 unstable loci
33 1 1 1 1 0 1 BAT-26 unstable
34 1 0 0 0 2 0 0/1 unstable loci
35 1 1 1 0 0 1 BAT-26 unstable
36 2 0 0 0 0 0 0/1 unstable loci
37 1 0 0 0 0 0 0/1 unstable loci
38 2 0 0 0 0 0 0/1 unstable loci
39 1 0 0 0 0 0 0/1 unstable loci
40 1 0 0 0 2 0 0/1 unstable loci
LOH k12 K12AA k13 K13AA M677 M1298 p16 p14 mlh1 BAT26 mlh1c
1 negative 1 GTT 0 . 1 0 1 0 1 0 0
2 negative 0 . 0 . 1 0 0 0 0 0 0
3 negative 0 . 0 . 1 0 2 0 0 0 0
4 negative 0 . 0 . 0 1 0 1 0 0 0
5 negative 0 . 0 . 1 0 0 0 1 0 0
6 negative 1 GAT 0 . 1 1 0 0 0 0 0
7 negative 1 GAT 0 . 2 0 3 0 0 0 0
8 negative 0 . 0 . 1 1 0 0 0 0 0
9 positive LOH 1 GTT 0 . 1 0 0 0 0 0 0
10 negative 0 . 0 . 1 0 0 0 0 0 0
11 negative 0 . 1 GAC 0 2 1 0 0 0 0
12 negative 0 . 1 GAC 2 0 0 0 0 0 0
13 positive LOH 0 . 0 . 2 0 0 0 0 0 0
14 negative 1 GAT 0 . 0 2 0 0 0 0 0
15 negative 0 . 0 . 1 1 3 2 1 1 1
16 negative 0 . 1 GAC 2 0 0 0 0 0 0
17 positive LOH 0 . 0 . 1 1 1 1 0 0 0
18 negative 1 GAT 0 . 0 2 3 1 0 0 0
19 positive LOH 0 . 1 GAC 1 1 0 1 0 0 0
20 negative 0 . 0 . 1 1 0 0 0 0 0
21 negative 0 . 0 . 1 1 1 0 0 0 0
22 negative 0 . 0 . 1 0 0 0 1 0 0
23 negative 0 . 0 . 1 0 0 0 0 0 0
24 negative 0 . 0 . 1 0 0 0 0 0 0
25 negative 0 . 0 . 2 0 0 0 0 0 0
26 negative 1 GTT 0 . 0 1 0 0 0 0 0
27 NA NA NA NA NA NA NA NA NA
28 negative 0 . 0 . 0 1 0 0 1 0 0
29 0 . 0 . 1 0 1 0 0 0 0
30 negative 0 . 0 . 1 0 0 0 0 0 0
31 negative 0 . 0 . 0 2 2 1 1 1 1
32 positive LOH 1 GTT 0 . 1 1 0 0 0 0 0
33 negative 0 . 0 . 0 0 2 2 1 1 1
34 positive LOH 0 . 0 . 0 1 0 0 0 0 0
35 negative 0 . 0 . 2 0 2 2 1 1 1
36 negative 0 . 0 . 2 0 0 0 0 0 0
37 negative 0 . 0 . 1 1 0 0 0 0 0
38 negative 0 . 0 . 1 0 0 1 0 1 0
39 negative 0 . 0 . 0 1 0 0 0 0 0
40 positive LOH 1 GAT 0 . 0 1 3 0 1 0 0
mi misum CGHSTAT
1 0/1 unstable loci 0 Complete
2 >2 loci unstable 3 Complete
3 0/1 unstable loci 0 Complete
4 0/1 unstable loci 0 Not Done
5 0/1 unstable loci 1 Not Done
6 0/1 unstable loci 0 Not Done
7 0/1 unstable loci 0 Complete
8 0/1 unstable loci 1 Not Done
9 0/1 unstable loci 0 Complete
10 0/1 unstable loci 0 Complete
11 0/1 unstable loci 0 Not Done
12 2 loci unstable 2 Complete
13 0/1 unstable loci 0 Complete
14 0/1 unstable loci 0 Complete
15 >2 loci unstable 5 Complete
16 0/1 unstable loci 0 Complete
17 0/1 unstable loci 1 Not Done
18 0/1 unstable loci 0 Complete
19 0/1 unstable loci 0 Not Done
20 0/1 unstable loci 0 Not Done
21 2 loci unstable 2 Not Done
22 0/1 unstable loci 0 Complete
23 0/1 unstable loci 0 Complete
24 0/1 unstable loci 0 Complete
25 0/1 unstable loci 1 Not Done
26 0/1 unstable loci 0 Not Done
27 NA Not Done
28 0/1 unstable loci 0 Complete
29 0 Complete
30 0/1 unstable loci 0 Not Done
31 >2 loci unstable 5 Complete
32 0/1 unstable loci 0 Complete
33 >2 loci unstable 4 Complete
34 0/1 unstable loci 0 Complete
35 >2 loci unstable 3 Not Done
36 0/1 unstable loci 0 Complete
37 0/1 unstable loci 0 Complete
38 0/1 unstable loci 0 Complete
39 0/1 unstable loci 0 Complete
40 0/1 unstable loci 0 Not Done
> plot(colorectal)
>
> ## Subsetting aCGH object
>
> colorectal[1:1000, 1:30]
aCGH object
Call: `[.aCGH`(colorectal, 1:1000, 1:30)
Number of Arrays 30
Number of Clones 1000
Warning message:
In `[.aCGH`(colorectal, 1:1000, 1:30) : subsetting the log2.ratios only
>
> ## Imputing the log2 ratios
>
> log2.ratios.imputed(ex.acgh) <- impute.lowess(ex.acgh)
Processing chromosome 1
Processing chromosome 2
Processing chromosome 3
Processing chromosome 4
Processing chromosome 5
Processing chromosome 6
Processing chromosome 7
Processing chromosome 8
Processing chromosome 9
Processing chromosome 10
Processing chromosome 11
Processing chromosome 12
Processing chromosome 13
Processing chromosome 14
Processing chromosome 15
Processing chromosome 16
Processing chromosome 17
Processing chromosome 18
Processing chromosome 19
Processing chromosome 20
Processing chromosome 21
Processing chromosome 22
Processing chromosome 23
>
> ## Determining hmm states of the clones
> ## WARNING: Calculating the states takes some time
>
> ##in the interests of time, hmm-finding function is commented out
> ##instead the states previosuly save are assigned
> ##hmm(ex.acgh) <- find.hmm.states(ex.acgh)
>
> hmm(ex.acgh) <- ex.acgh.hmm
> hmm.merged(ex.acgh) <-
+ mergeHmmStates(ex.acgh, model.use = 1, minDiff = .25)
>
> ## Calculating the standard deviations for each array
>
> sd.samples(ex.acgh) <- computeSD.Samples(ex.acgh)
>
> ## Finding the genomic events associated with each sample
>
> genomic.events(ex.acgh) <- find.genomic.events(ex.acgh)
Finding outliers
Finding focal low level aberrations
Finding transitions
Finding focal amplifications
Processing chromosome 1
Processing chromosome 2
Processing chromosome 3
Processing chromosome 4
Processing chromosome 5
Processing chromosome 6
Processing chromosome 7
Processing chromosome 8
Processing chromosome 9
Processing chromosome 10
Processing chromosome 11
Processing chromosome 12
Processing chromosome 13
Processing chromosome 14
Processing chromosome 15
Processing chromosome 16
Processing chromosome 17
Processing chromosome 18
Processing chromosome 19
Processing chromosome 20
Processing chromosome 21
Processing chromosome 22
Processing chromosome 23
Warning messages:
1: In min(indstretch[indstretch > indaber[m]]) :
no non-missing arguments to min; returning Inf
2: In min(indstretch[indstretch > indaber[m]]) :
no non-missing arguments to min; returning Inf
3: In min(indstretch[indstretch > indaber[m]]) :
no non-missing arguments to min; returning Inf
4: In max(indstretch[indstretch < indaber[m]]) :
no non-missing arguments to max; returning -Inf
5: In min(indstretch[indstretch > indaber[m]]) :
no non-missing arguments to min; returning Inf
6: In min(indstretch[indstretch > indaber[m]]) :
no non-missing arguments to min; returning Inf
7: In min(indstretch[indstretch > indaber[m]]) :
no non-missing arguments to min; returning Inf
8: In min(indstretch[indstretch > indaber[m]]) :
no non-missing arguments to min; returning Inf
>
> ## Plotting and printing the hmm states
>
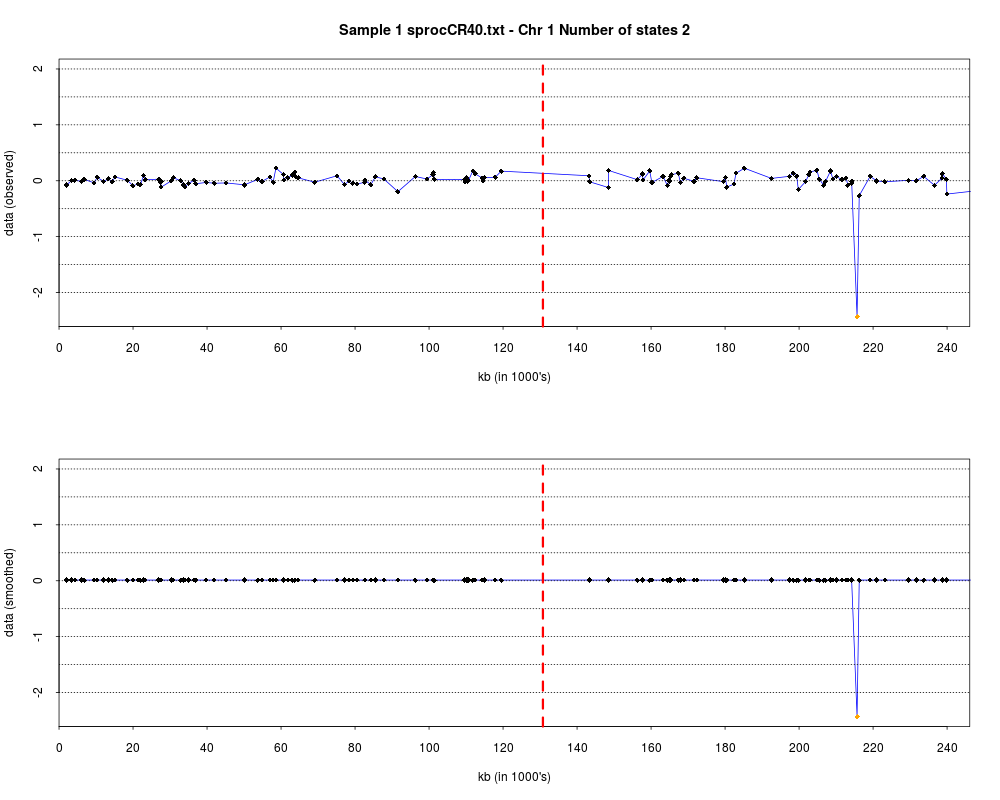
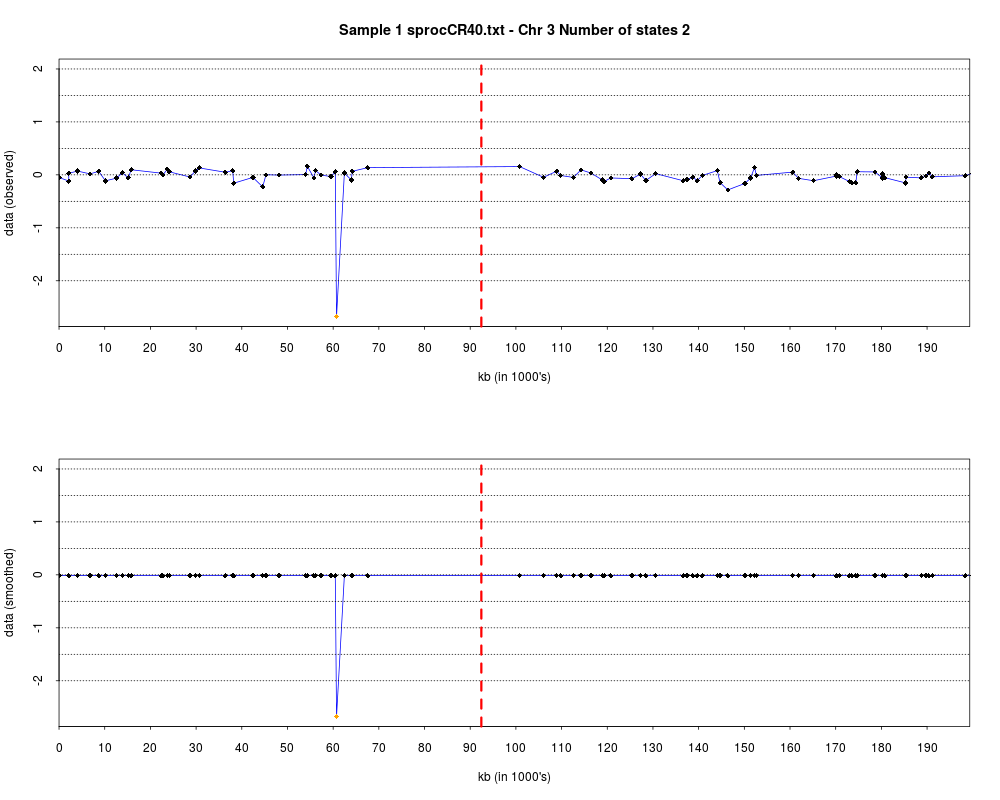
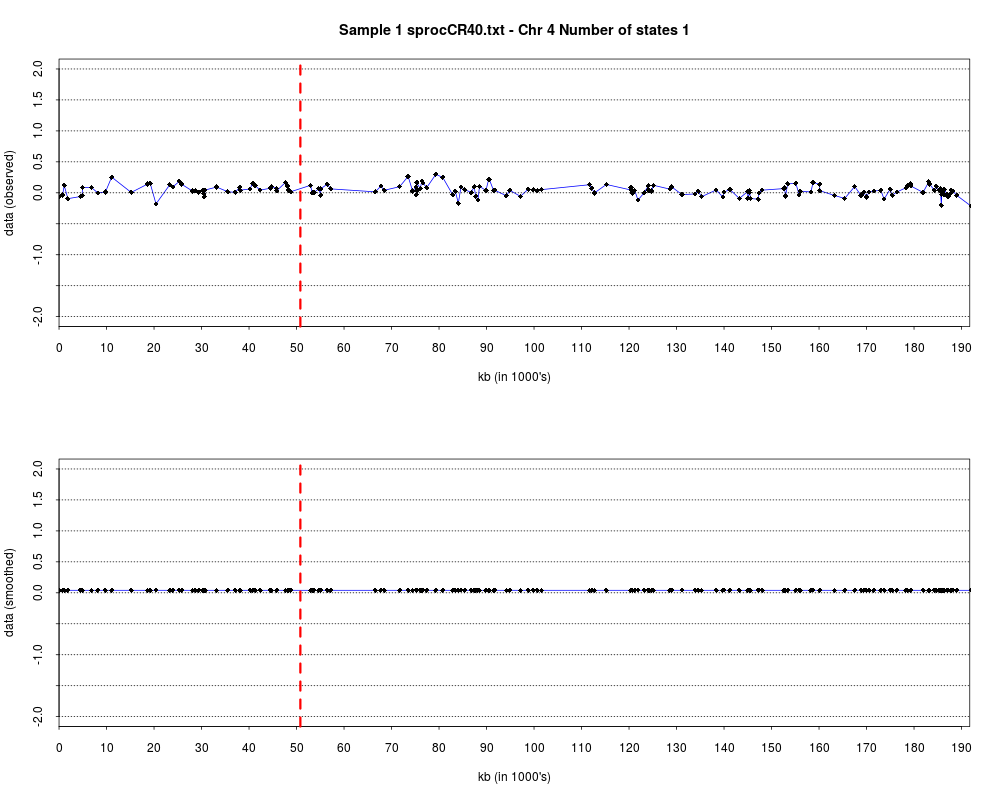
> plotHmmStates(ex.acgh, 1)
> pdf("hmm.states.temp.pdf")
> plotHmmStates(ex.acgh, 1)
> dev.off()
png
2
>
> ## Plotting summary of the sample profiles
>
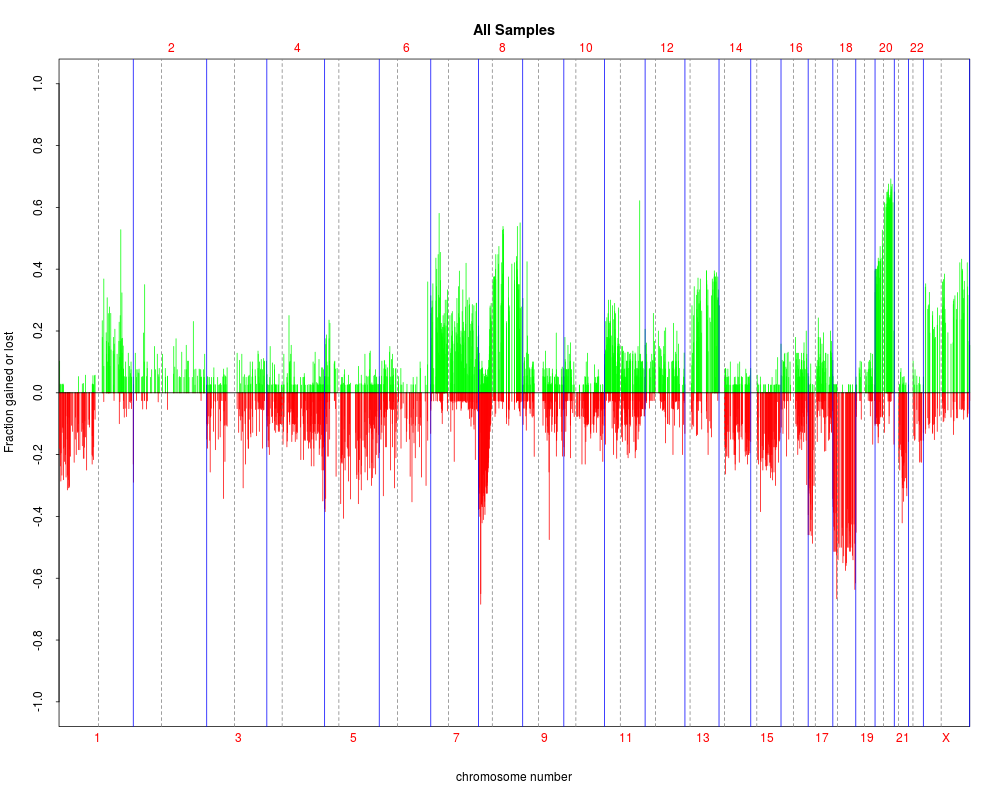
> plotSummaryProfile(colorectal)
Warning messages:
1: In bxp(list(stats = c(0, 0.5, 4, 5, 10), n = 40, conf = c(2.87581029181014, :
some notches went outside hinges ('box'): maybe set notch=FALSE
2: In bxp(list(stats = c(0, 0, 0, 0.5, 1), n = 40, conf = c(-0.124909967576651, :
some notches went outside hinges ('box'): maybe set notch=FALSE
3: In bxp(list(stats = c(0, 0, 0, 0.5, 1), n = 40, conf = c(-0.124909967576651, :
some notches went outside hinges ('box'): maybe set notch=FALSE
>
>
>
>
>
>
>
>
> dev.off()
null device
1
>
|