phenotype of interest. defaults to the same phenotype
assigned to all samples
chrominfo
a chromosomal information associated with the mapping
of the data
cutoff
maximum absolute value. all the values are floored to
+/-cutoff depending on whether they are positive of
negative. defaults to 1
ncolors
number of colors in the grid. input to
maPalette. defaults to 50
lowCol
color for the low (negative) values. input to
maPalette. defaults to "red"
highCol
color for the high (positive) values. input to
maPalette. defaults to "green"
midCol
color for the values close to 0. input to
maPalette. defaults to "black"
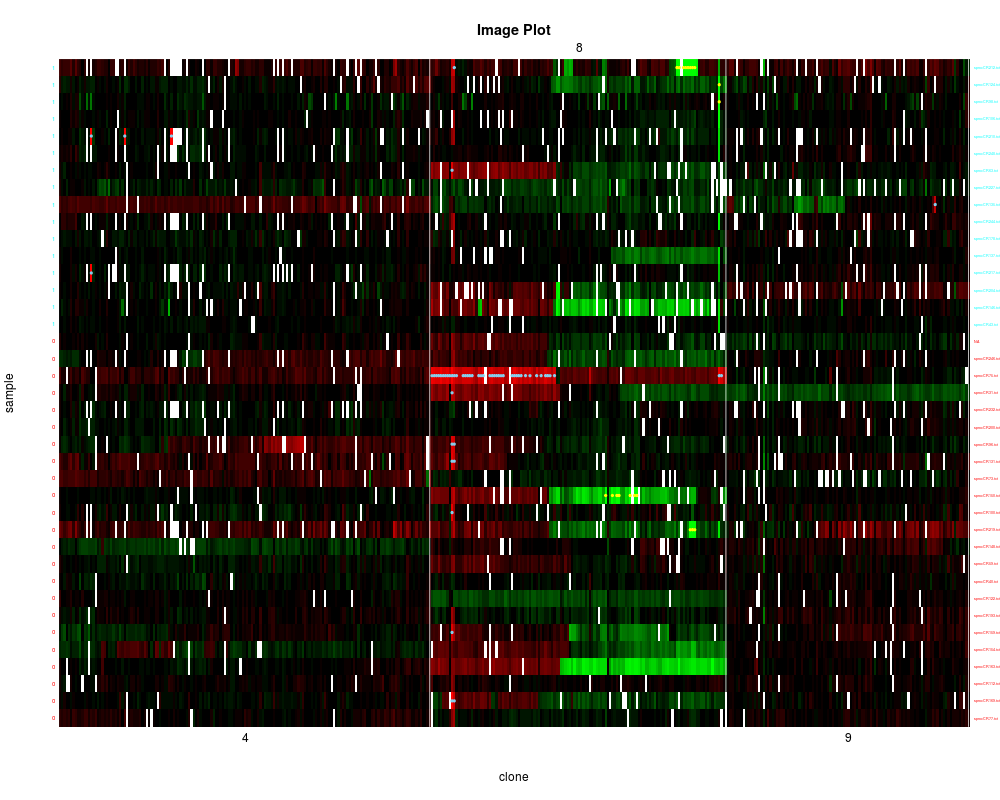
byclass
logical indicating whether samples should be clustered within each level of the phenotype or overall. defaults to F
showaber
logical indicating whether high level amplifications and homozygous deletions should be indicated on the plot. defaults to F
amplif
positive value that all observations equal or exceeding it are marked by yellow dots indicating high-level changes. defaults to 1
homdel
negative value that all observations equal or below it are marked by light blue dots indicating homozygous deletions. defaults to -0.75
samplenames
sample names
vecchrom
vector of chromosomal indeces to use for clustering and to display. defaults to 1:23
titles
plot title. defaults to "Image Plots"
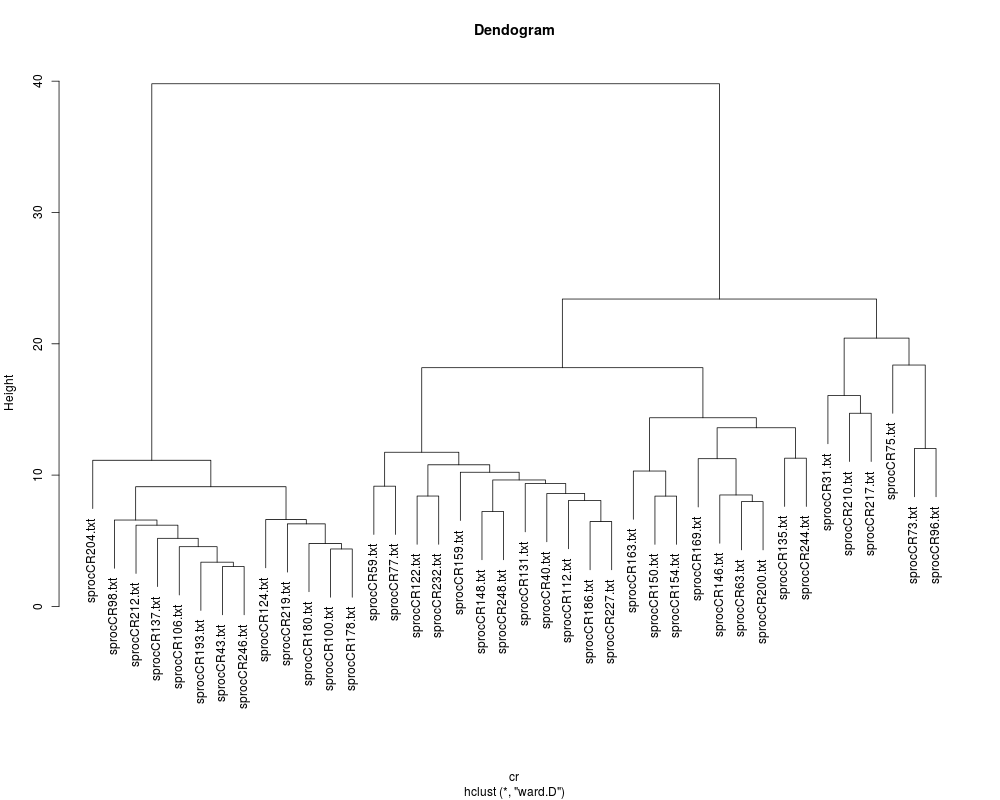
methodS
clustering method to cluster samples. defaults to "ward"
dendPlot
logical indicating whether dendogram needs to be
drawn. defaults to T.
imp
logical indicating whether imputed or original values should be used. defaults to T, i.e. imputed.
categoricalPheno
logical indicating whether phenotype is
categorical. Continious phenotypes are treated as "no groups" except
that their values are dispalyed.defaults to TRUE.
Details
This functions is a more flexible version of the
heatmap. It can cluster within levels of categorical
phenotype as well as all of the samples while displaying phenotype
levels in different colors. It also uses any combination of
chromosomes that is requested and clusters samples based on these
chromosomes only. It draws the chromosomal boundaries and displays
high level changes and homozygous deletions. If phenotype if not
categical, its values may still be displayed but groups are not formed
and byclass = F.
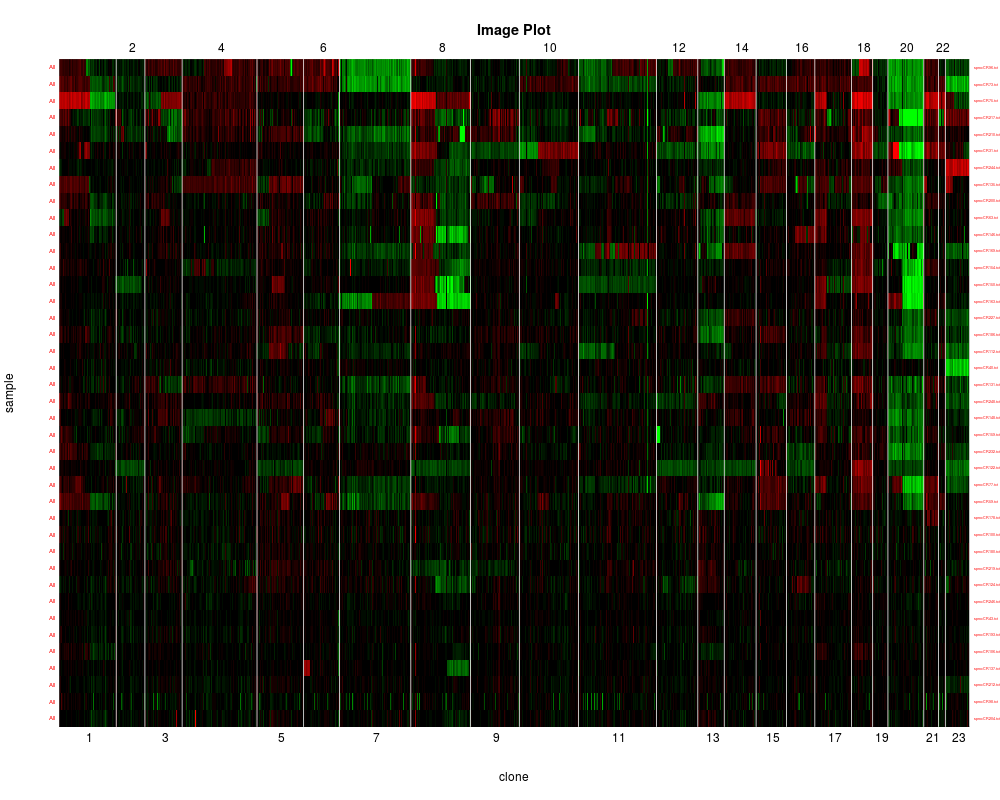
Image plot has the samples reordered according to clustering order.
See Also
aCGHheatmap
Examples
data(colorectal)

#cluster all samples using imputed data on all chromosomes (autosomes and X):

clusterGenome(colorectal)

#cluster samples within sex groups based on 3 chromosomes individually.
#use non-imputed data and  do not show dendogram. Indicate amplifications and
#homozygous deletions.

clusterGenome(colorectal, response = phenotype(colorectal)$sex,
                   byclass = TRUE, showaber = TRUE, vecchrom = c(4,8,9),
                   dendPlot = FALSE, imp = FALSE)

#cluster samples based on each chromosome individualy and display age. Show
#gains in red and losses in green. Show aberrations and use values < -1
#to identify homozgous deletions. Do not show dendogram.

pdf("plotimages.pdf", width = 11, height = 8.5)
for (i in 1:23)
    clusterGenome(colorectal,
                       response = phenotype(colorectal)$age,
                       chrominfo = human.chrom.info.Jul03,
                       cutoff = 1, ncolors = 50, lowCol="green",
                       highCol="red", midCol="black", byclass = FALSE,
                       showaber = TRUE, homdel = -1, vecchrom = i,
                       titles = "Image Plot", methodS = "ward",
                       dendPlot = FALSE, categoricalPheno = FALSE)
dev.off()
Results
R version 3.3.1 (2016-06-21) -- "Bug in Your Hair"
Copyright (C) 2016 The R Foundation for Statistical Computing
Platform: x86_64-pc-linux-gnu (64-bit)

R is free software and comes with ABSOLUTELY NO WARRANTY.
You are welcome to redistribute it under certain conditions.
Type 'license()' or 'licence()' for distribution details.

R is a collaborative project with many contributors.
Type 'contributors()' for more information and
'citation()' on how to cite R or R packages in publications.

Type 'demo()' for some demos, 'help()' for on-line help, or
'help.start()' for an HTML browser interface to help.
Type 'q()' to quit R.

> library(aCGH)
Loading required package: cluster
Loading required package: survival
Loading required package: multtest
Loading required package: BiocGenerics
Loading required package: parallel

Attaching package: 'BiocGenerics'

The following objects are masked from 'package:parallel':

    clusterApply, clusterApplyLB, clusterCall, clusterEvalQ,
    clusterExport, clusterMap, parApply, parCapply, parLapply,
    parLapplyLB, parRapply, parSapply, parSapplyLB

The following objects are masked from 'package:stats':

    IQR, mad, xtabs

The following objects are masked from 'package:base':

    Filter, Find, Map, Position, Reduce, anyDuplicated, append,
    as.data.frame, cbind, colnames, do.call, duplicated, eval, evalq,
    get, grep, grepl, intersect, is.unsorted, lapply, lengths, mapply,
    match, mget, order, paste, pmax, pmax.int, pmin, pmin.int, rank,
    rbind, rownames, sapply, setdiff, sort, table, tapply, union,
    unique, unsplit

Loading required package: Biobase
Welcome to Bioconductor

    Vignettes contain introductory material; view with
    'browseVignettes()'. To cite Bioconductor, see
    'citation("Biobase")', and for packages 'citation("pkgname")'.


Attaching package: 'aCGH'

The following object is masked from 'package:stats':

    heatmap

> png(filename="/home/ddbj/snapshot/RGM3/R_BC/result/aCGH/clusterGenome.Rd_%03d_medium.png", width=480, height=480)
> ### Name: clusterGenome
> ### Title: clustering and heatmap
> ### Aliases: clusterGenome plotvalChrom.func plotValGenome plotValChrom
> ###   plotChrom
> ### Keywords: hplot cluster
>
> ### ** Examples
>
> data(colorectal)
>
> #cluster all samples using imputed data on all chromosomes (autosomes and X):
>
> clusterGenome(colorectal)
The "ward" method has been renamed to "ward.D"; note new "ward.D2"
The "ward" method has been renamed to "ward.D"; note new "ward.D2"
Warning message:
In `[.aCGH`(aCGH.obj, , !is.na(response)) : subsetting the log2.ratios only
>
> #cluster samples within sex groups based on 3 chromosomes individually.
> #use non-imputed data and  do not show dendogram. Indicate amplifications and
> #homozygous deletions.
>
> clusterGenome(colorectal, response = phenotype(colorectal)$sex,
+                    byclass = TRUE, showaber = TRUE, vecchrom = c(4,8,9),
+                    dendPlot = FALSE, imp = FALSE)
The "ward" method has been renamed to "ward.D"; note new "ward.D2"
The "ward" method has been renamed to "ward.D"; note new "ward.D2"
Warning message:
In `[.aCGH`(aCGH.obj, , !is.na(response)) : subsetting the log2.ratios only
>
> #cluster samples based on each chromosome individualy and display age. Show
> #gains in red and losses in green. Show aberrations and use values < -1
> #to identify homozgous deletions. Do not show dendogram.
>
> pdf("plotimages.pdf", width = 11, height = 8.5)
> for (i in 1:23)
+     clusterGenome(colorectal,
+                        response = phenotype(colorectal)$age,
+                        chrominfo = human.chrom.info.Jul03,
+                        cutoff = 1, ncolors = 50, lowCol="green",
+                        highCol="red", midCol="black", byclass = FALSE,
+                        showaber = TRUE, homdel = -1, vecchrom = i,
+                        titles = "Image Plot", methodS = "ward",
+                        dendPlot = FALSE, categoricalPheno = FALSE)
The "ward" method has been renamed to "ward.D"; note new "ward.D2"
The "ward" method has been renamed to "ward.D"; note new "ward.D2"
The "ward" method has been renamed to "ward.D"; note new "ward.D2"
The "ward" method has been renamed to "ward.D"; note new "ward.D2"
The "ward" method has been renamed to "ward.D"; note new "ward.D2"
The "ward" method has been renamed to "ward.D"; note new "ward.D2"
The "ward" method has been renamed to "ward.D"; note new "ward.D2"
The "ward" method has been renamed to "ward.D"; note new "ward.D2"
The "ward" method has been renamed to "ward.D"; note new "ward.D2"
The "ward" method has been renamed to "ward.D"; note new "ward.D2"
The "ward" method has been renamed to "ward.D"; note new "ward.D2"
The "ward" method has been renamed to "ward.D"; note new "ward.D2"
The "ward" method has been renamed to "ward.D"; note new "ward.D2"
The "ward" method has been renamed to "ward.D"; note new "ward.D2"
The "ward" method has been renamed to "ward.D"; note new "ward.D2"
The "ward" method has been renamed to "ward.D"; note new "ward.D2"
The "ward" method has been renamed to "ward.D"; note new "ward.D2"
The "ward" method has been renamed to "ward.D"; note new "ward.D2"
The "ward" method has been renamed to "ward.D"; note new "ward.D2"
The "ward" method has been renamed to "ward.D"; note new "ward.D2"
The "ward" method has been renamed to "ward.D"; note new "ward.D2"
The "ward" method has been renamed to "ward.D"; note new "ward.D2"
The "ward" method has been renamed to "ward.D"; note new "ward.D2"
There were 23 warnings (use warnings() to see them)
> dev.off()
png
  2
>
>
>
>
>
>
> dev.off()
null device
          1
>
 .
.