Supported by Dr. Osamu Ogasawara and  . . |
|
Last data update: 2014.03.03 |
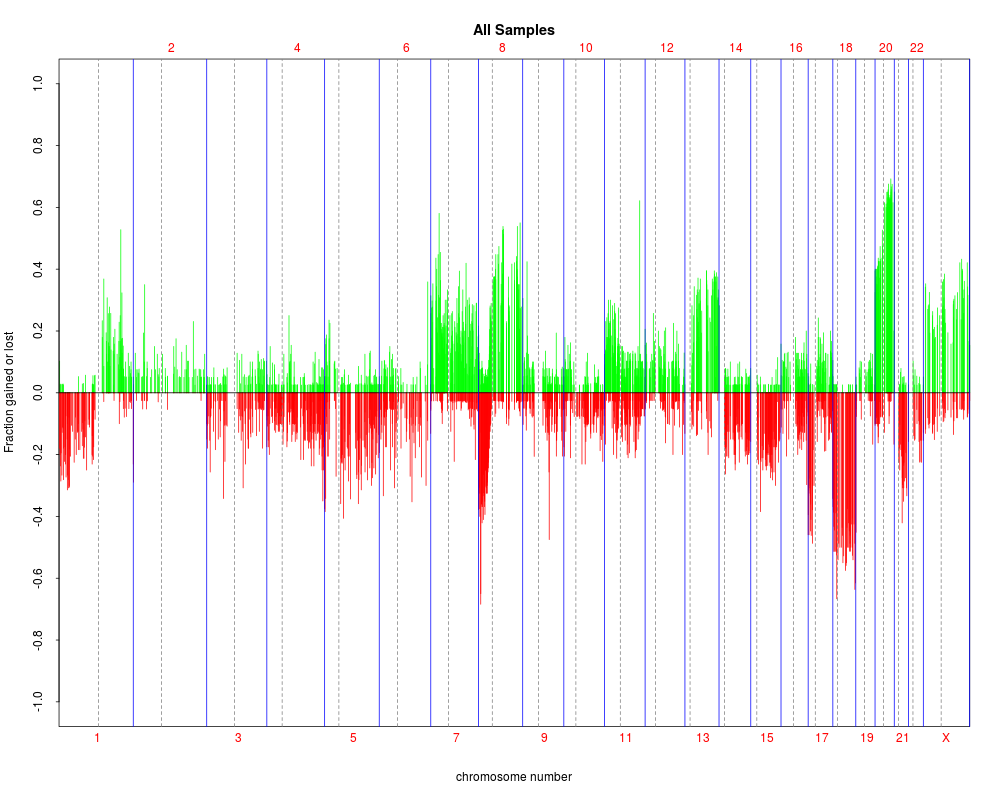
Colorectal array CGH datasetDescriptionThe colorectal dataset is an object of class Usagedata(colorectal) SourceThese data were generated at Dr. Fred Waldman's lab at UCSF Cancer Center by K. Nakao and K. Mehta. The manuscript describing the data and the analysis are described in High-resolution analysis of DNA copy number alterations in colorectal cancer by array-based comparative genomic hybridization, Carcinogenesis, 2004, Nakao et. al. ReferencesNakao et. al., High-resolution analysis of DNA copy number alterations in colorectal cancer by array-based comparative genomic hybridization, Carcinogenesis, 2004 Jain et. al, Fully automatic quantification of microarray image data, Genome Research, 2003 See Also
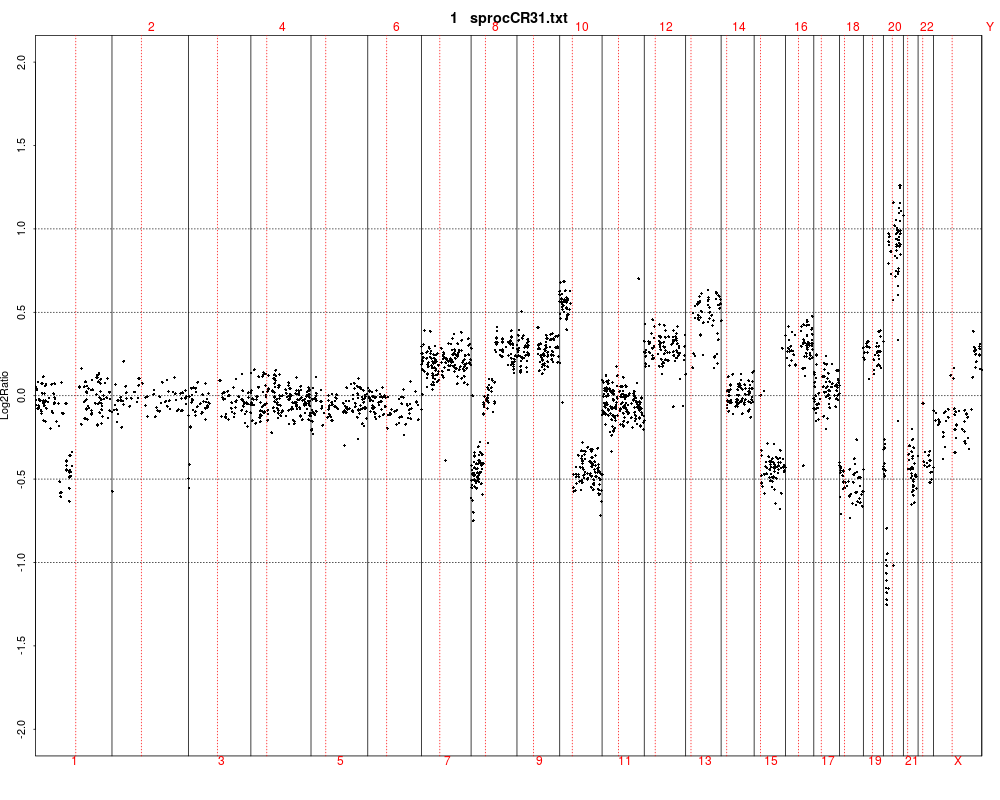
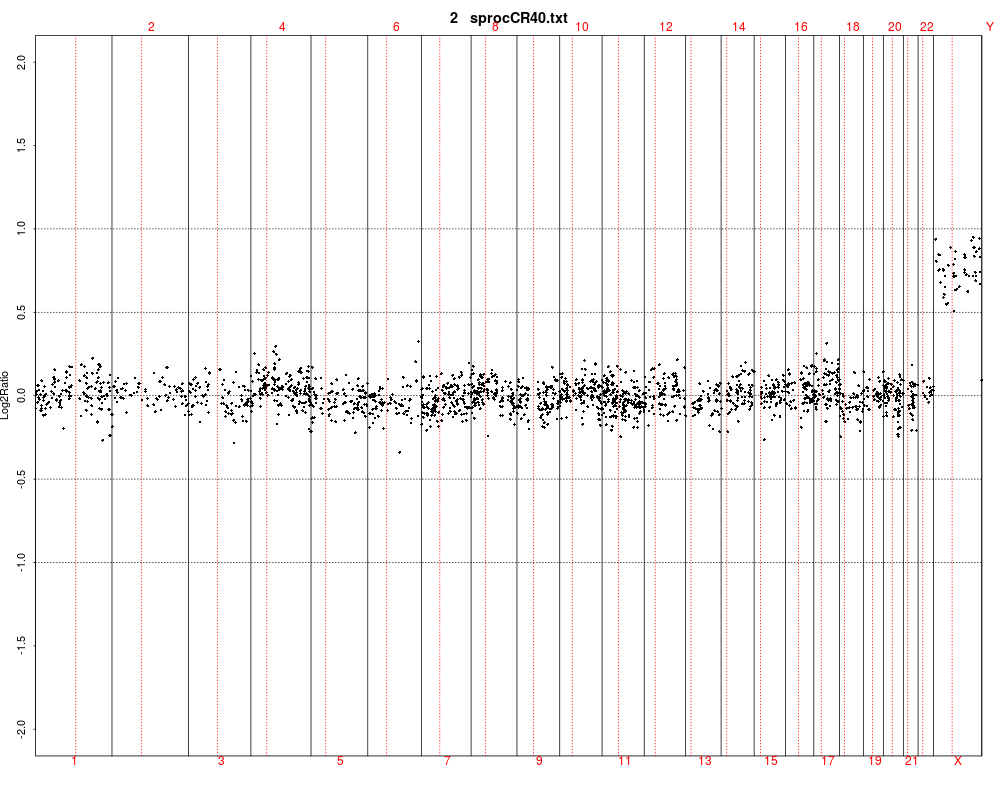
Examplesdata(colorectal) ## WARNING: plotting the heatmap takes some time plot(colorectal) plotGenome(colorectal[,1:2]) Results
R version 3.3.1 (2016-06-21) -- "Bug in Your Hair"
Copyright (C) 2016 The R Foundation for Statistical Computing
Platform: x86_64-pc-linux-gnu (64-bit)

R is free software and comes with ABSOLUTELY NO WARRANTY.
You are welcome to redistribute it under certain conditions.
Type 'license()' or 'licence()' for distribution details.

R is a collaborative project with many contributors.
Type 'contributors()' for more information and
'citation()' on how to cite R or R packages in publications.

Type 'demo()' for some demos, 'help()' for on-line help, or
'help.start()' for an HTML browser interface to help.
Type 'q()' to quit R.

> library(aCGH)
Loading required package: cluster
Loading required package: survival
Loading required package: multtest
Loading required package: BiocGenerics
Loading required package: parallel

Attaching package: 'BiocGenerics'

The following objects are masked from 'package:parallel':

    clusterApply, clusterApplyLB, clusterCall, clusterEvalQ,
    clusterExport, clusterMap, parApply, parCapply, parLapply,
    parLapplyLB, parRapply, parSapply, parSapplyLB

The following objects are masked from 'package:stats':

    IQR, mad, xtabs

The following objects are masked from 'package:base':

    Filter, Find, Map, Position, Reduce, anyDuplicated, append,
    as.data.frame, cbind, colnames, do.call, duplicated, eval, evalq,
    get, grep, grepl, intersect, is.unsorted, lapply, lengths, mapply,
    match, mget, order, paste, pmax, pmax.int, pmin, pmin.int, rank,
    rbind, rownames, sapply, setdiff, sort, table, tapply, union,
    unique, unsplit

Loading required package: Biobase
Welcome to Bioconductor

    Vignettes contain introductory material; view with
    'browseVignettes()'. To cite Bioconductor, see
    'citation("Biobase")', and for packages 'citation("pkgname")'.


Attaching package: 'aCGH'

The following object is masked from 'package:stats':

    heatmap

> png(filename="/home/ddbj/snapshot/RGM3/R_BC/result/aCGH/colorectal.Rd_%03d_medium.png", width=480, height=480)
> ### Name: colorectal
> ### Title: Colorectal array CGH dataset
> ### Aliases: colorectal clones.info.ex log2.ratios.ex pheno.type.ex
> ### Keywords: datasets
>
> ### ** Examples
>
>
> data(colorectal)
> ## WARNING: plotting the heatmap takes some time
> plot(colorectal)
> plotGenome(colorectal[,1:2])
Warning message:
In `[.aCGH`(colorectal, , 1:2) : subsetting the log2.ratios only
>
>
>
>
>
>
> dev.off()
null device
          1
>
|