R: Function to compute proportion of gains and losses for each...
gainLoss
R Documentation
Function to compute proportion of gains and losses for each clones
Description
This function outputs lists containing proportion of gains and losses for each clone.
Usage
gainLoss(dat, cols, thres=0.25)
Arguments
dat
log2ratios of the relevant array CGH object
cols
indeces of the samples to use
thres
global or tumor-specific threshold. defaults to 0.25
Value
gainP
Vector of proportion gained for each clones
lossP
Vector of proportion lost for each clones
Author(s)
Jane Fridlyand
See Also
plotFreqStat
Examples
data(colorectal)
## Use mt.maxT function from multtest package to test
## differences in group means for each clone grouped by sex
##use only clones with show gain or loss in at least 10% of the samples
colnames(phenotype(colorectal))
sex <- phenotype(colorectal)$sex
sex.na <- !is.na(sex)
colorectal.na <- colorectal[ ,sex.na, keep = TRUE ]
factor <- 2.5
minChanged <- 0.1
gainloss <- gainLoss(log2.ratios(colorectal.na), cols=1:ncol(colorectal.na), thres=factor*sd.samples(colorectal.na)$madGenome)
ind.clones.use <- which(gainloss$gainP >= minChanged | gainloss$lossP>= minChanged)
#create filtered dataset
colorectal.na <- colorectal.na[ind.clones.use,keep=TRUE]
dat <- log2.ratios.imputed(colorectal.na)
resT.sex <- mt.maxT(dat, sex[sex.na],test = "t.equalvar", B = 1000)
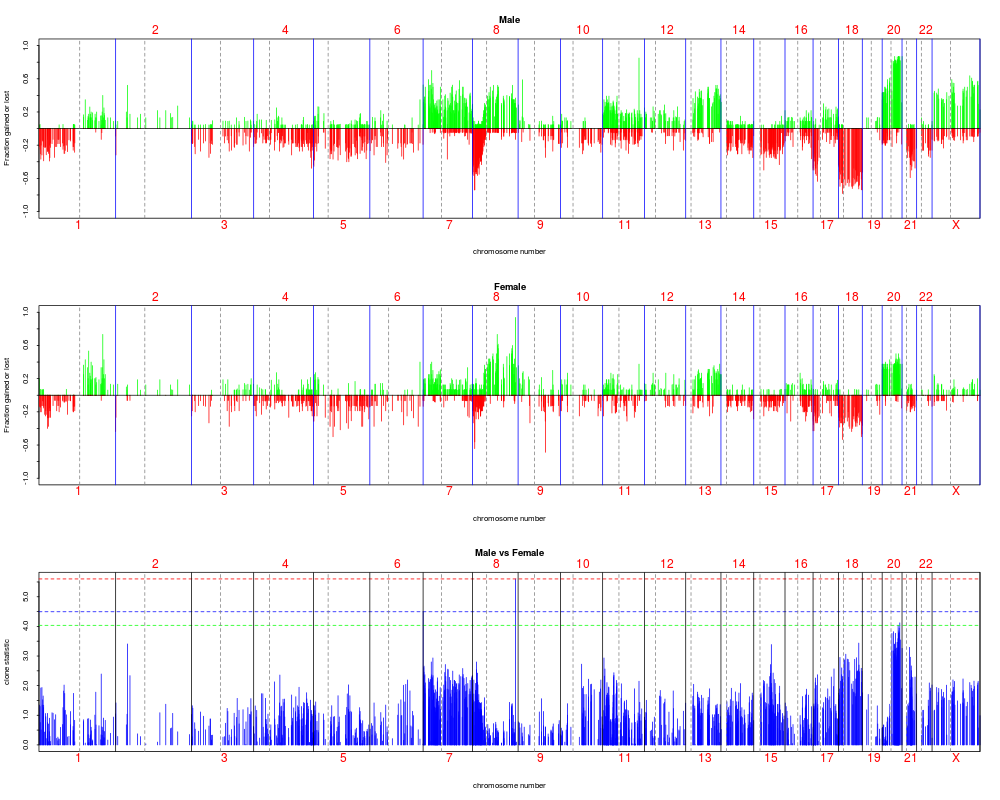
## Plot the result along the genome
plotFreqStat(colorectal.na, resT.sex, sex[sex.na],factor=factor,titles = c("Male", "Female"))
Results
R version 3.3.1 (2016-06-21) -- "Bug in Your Hair"
Copyright (C) 2016 The R Foundation for Statistical Computing
Platform: x86_64-pc-linux-gnu (64-bit)

R is free software and comes with ABSOLUTELY NO WARRANTY.
You are welcome to redistribute it under certain conditions.
Type 'license()' or 'licence()' for distribution details.

R is a collaborative project with many contributors.
Type 'contributors()' for more information and
'citation()' on how to cite R or R packages in publications.

Type 'demo()' for some demos, 'help()' for on-line help, or
'help.start()' for an HTML browser interface to help.
Type 'q()' to quit R.

> library(aCGH)
Loading required package: cluster
Loading required package: survival
Loading required package: multtest
Loading required package: BiocGenerics
Loading required package: parallel

Attaching package: 'BiocGenerics'

The following objects are masked from 'package:parallel':

    clusterApply, clusterApplyLB, clusterCall, clusterEvalQ,
    clusterExport, clusterMap, parApply, parCapply, parLapply,
    parLapplyLB, parRapply, parSapply, parSapplyLB

The following objects are masked from 'package:stats':

    IQR, mad, xtabs

The following objects are masked from 'package:base':

    Filter, Find, Map, Position, Reduce, anyDuplicated, append,
    as.data.frame, cbind, colnames, do.call, duplicated, eval, evalq,
    get, grep, grepl, intersect, is.unsorted, lapply, lengths, mapply,
    match, mget, order, paste, pmax, pmax.int, pmin, pmin.int, rank,
    rbind, rownames, sapply, setdiff, sort, table, tapply, union,
    unique, unsplit

Loading required package: Biobase
Welcome to Bioconductor

    Vignettes contain introductory material; view with
    'browseVignettes()'. To cite Bioconductor, see
    'citation("Biobase")', and for packages 'citation("pkgname")'.


Attaching package: 'aCGH'

The following object is masked from 'package:stats':

    heatmap

> png(filename="/home/ddbj/snapshot/RGM3/R_BC/result/aCGH/gainLoss.Rd_%03d_medium.png", width=480, height=480)
> ### Name: gainLoss
> ### Title: Function to compute proportion of gains and losses for each
> ###   clones
> ### Aliases: gainLoss
> ### Keywords: htest
>
> ### ** Examples
>
>
> data(colorectal)
>
> ## Use mt.maxT function from multtest package to test
> ## differences in group means for each clone grouped by sex
> ##use only clones with show gain or loss in at least 10% of the samples
> colnames(phenotype(colorectal))
 [1] "id"      "age"     "sex"     "stage"   "loc"     "hist"    "diff"
 [8] "gstm1"   "gstt1"   "nqo"     "K12"     "K13"     "MTHFR"   "ERCC1"
[15] "bat26"   "bat25"   "D5S346"  "D17S250" "D2S123"  "mi2"     "LOH"
[22] "k12"     "K12AA"   "k13"     "K13AA"   "M677"    "M1298"   "p16"
[29] "p14"     "mlh1"    "BAT26"   "mlh1c"   "mi"      "misum"   "CGHSTAT"
> sex <- phenotype(colorectal)$sex
> sex.na <- !is.na(sex)
> colorectal.na <- colorectal[ ,sex.na, keep = TRUE ]
> factor <- 2.5
> minChanged <- 0.1
> gainloss <- gainLoss(log2.ratios(colorectal.na), cols=1:ncol(colorectal.na), thres=factor*sd.samples(colorectal.na)$madGenome)
> ind.clones.use <- which(gainloss$gainP >= minChanged | gainloss$lossP>= minChanged)
> #create filtered dataset
> colorectal.na <- colorectal.na[ind.clones.use,keep=TRUE]
> dat <- log2.ratios.imputed(colorectal.na)
> resT.sex <- mt.maxT(dat, sex[sex.na],test = "t.equalvar", B = 1000)
b=10	b=20	b=30	b=40	b=50	b=60	b=70	b=80	b=90	b=100
b=110	b=120	b=130	b=140	b=150	b=160	b=170	b=180	b=190	b=200
b=210	b=220	b=230	b=240	b=250	b=260	b=270	b=280	b=290	b=300
b=310	b=320	b=330	b=340	b=350	b=360	b=370	b=380	b=390	b=400
b=410	b=420	b=430	b=440	b=450	b=460	b=470	b=480	b=490	b=500
b=510	b=520	b=530	b=540	b=550	b=560	b=570	b=580	b=590	b=600
b=610	b=620	b=630	b=640	b=650	b=660	b=670	b=680	b=690	b=700
b=710	b=720	b=730	b=740	b=750	b=760	b=770	b=780	b=790	b=800
b=810	b=820	b=830	b=840	b=850	b=860	b=870	b=880	b=890	b=900
b=910	b=920	b=930	b=940	b=950	b=960	b=970	b=980	b=990	b=1000
>
>
> ## Plot the result along the genome
> plotFreqStat(colorectal.na, resT.sex, sex[sex.na],factor=factor,titles = c("Male", "Female"))
>
>
>
>
>
>
>
> dev.off()
null device
          1
>
 .
.