Supported by Dr. Osamu Ogasawara and  . . |
|
Last data update: 2014.03.03 |
Creates heatmap array CGH objectsDescriptionClusters samples and produces heatmapp of the observed log2ratios. Usage
heatmap(x, imp = TRUE, Rowv = NA, Colv = NULL, distfun = dist,
        hclustfun = hclust, add.expr, symm = FALSE,
        revC = identical(Colv, "Rowv"), scale = "none",
        na.rm = TRUE, margins = c(5, 5), ColSideColors,
        RowSideColors, cexRow = 0.2 + 1 / log10(nr),
        cexCol = 0.2 + 1 / log10(nc), labRow = NULL,
        labCol = NULL, main = NULL, xlab = NULL, ylab = NULL,
        verbose = getOption("verbose"), methodR = "ward",
        methodC = "ward", zlm = c(-0.5, 0.5), ...)
Arguments
DetailsThis function is almost identical to the ValueInvisibly, a list with components
Referencesheatmap function in base R See Also
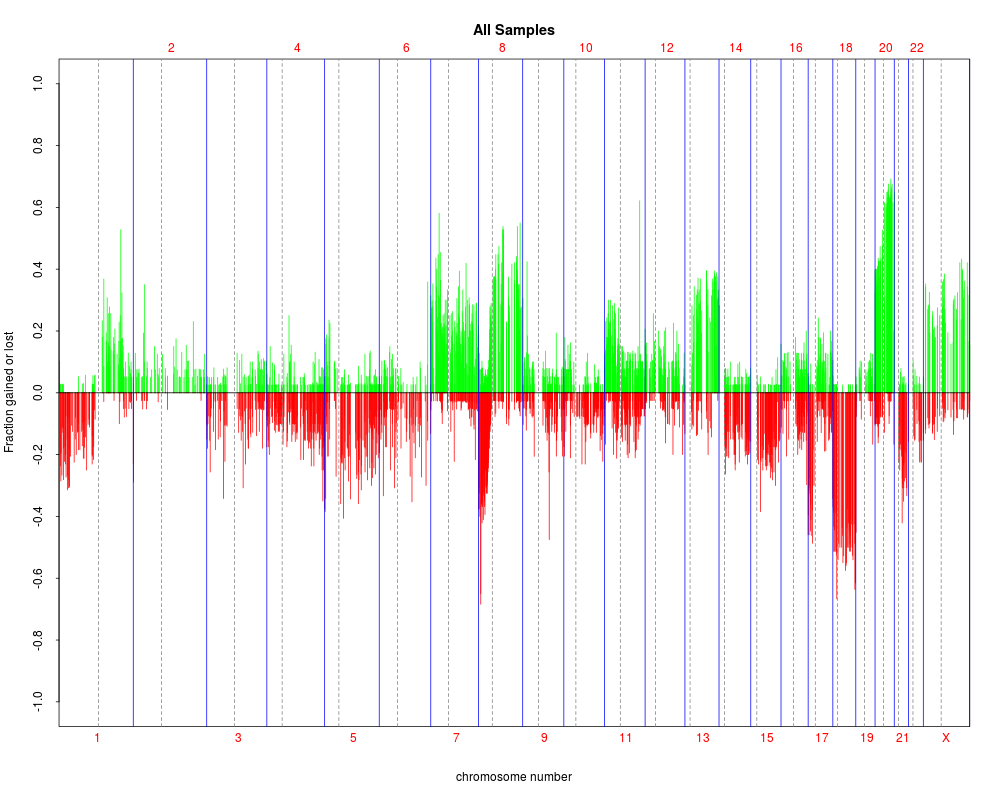
Examples#default plotting method for the aCGH object data(colorectal) plot(colorectal) #to produce smoother looking heatmap, use imp = T: this will use imputed #slot of aCGH object plot(colorectal, imp = TRUE) Results
R version 3.3.1 (2016-06-21) -- "Bug in Your Hair"
Copyright (C) 2016 The R Foundation for Statistical Computing
Platform: x86_64-pc-linux-gnu (64-bit)

R is free software and comes with ABSOLUTELY NO WARRANTY.
You are welcome to redistribute it under certain conditions.
Type 'license()' or 'licence()' for distribution details.

R is a collaborative project with many contributors.
Type 'contributors()' for more information and
'citation()' on how to cite R or R packages in publications.

Type 'demo()' for some demos, 'help()' for on-line help, or
'help.start()' for an HTML browser interface to help.
Type 'q()' to quit R.

> library(aCGH)
Loading required package: cluster
Loading required package: survival
Loading required package: multtest
Loading required package: BiocGenerics
Loading required package: parallel

Attaching package: 'BiocGenerics'

The following objects are masked from 'package:parallel':

    clusterApply, clusterApplyLB, clusterCall, clusterEvalQ,
    clusterExport, clusterMap, parApply, parCapply, parLapply,
    parLapplyLB, parRapply, parSapply, parSapplyLB

The following objects are masked from 'package:stats':

    IQR, mad, xtabs

The following objects are masked from 'package:base':

    Filter, Find, Map, Position, Reduce, anyDuplicated, append,
    as.data.frame, cbind, colnames, do.call, duplicated, eval, evalq,
    get, grep, grepl, intersect, is.unsorted, lapply, lengths, mapply,
    match, mget, order, paste, pmax, pmax.int, pmin, pmin.int, rank,
    rbind, rownames, sapply, setdiff, sort, table, tapply, union,
    unique, unsplit

Loading required package: Biobase
Welcome to Bioconductor

    Vignettes contain introductory material; view with
    'browseVignettes()'. To cite Bioconductor, see
    'citation("Biobase")', and for packages 'citation("pkgname")'.


Attaching package: 'aCGH'

The following object is masked from 'package:stats':

    heatmap

> png(filename="/home/ddbj/snapshot/RGM3/R_BC/result/aCGH/heatmap.Rd_%03d_medium.png", width=480, height=480)
> ### Name: heatmap
> ### Title: Creates heatmap array CGH objects
> ### Aliases: heatmap
> ### Keywords: hplot cluster
>
> ### ** Examples
>
>
> #default plotting method for the aCGH object
> data(colorectal)
> plot(colorectal)
>
> #to produce smoother looking heatmap, use imp = T: this will use imputed
> #slot of aCGH object
>
> plot(colorectal, imp = TRUE)
>
>
>
>
>
>
> dev.off()
null device
          1
>
|