Supported by Dr. Osamu Ogasawara and  . . |
|
Last data update: 2014.03.03 |
mergeLevelsDescriptionMerging of predicted levels for array CGH data and similar. UsagemergeLevels(vecObs,vecPred,pv.thres=0.0001,ansari.sign=0.05,thresMin=0.05,thresMax=0.5,verbose=1,scale=TRUE) Arguments
DetailsmergeLevels takes a vector of observed log2-ratios and predicted log2ratios and merges levels that are not significantly distinct. Value
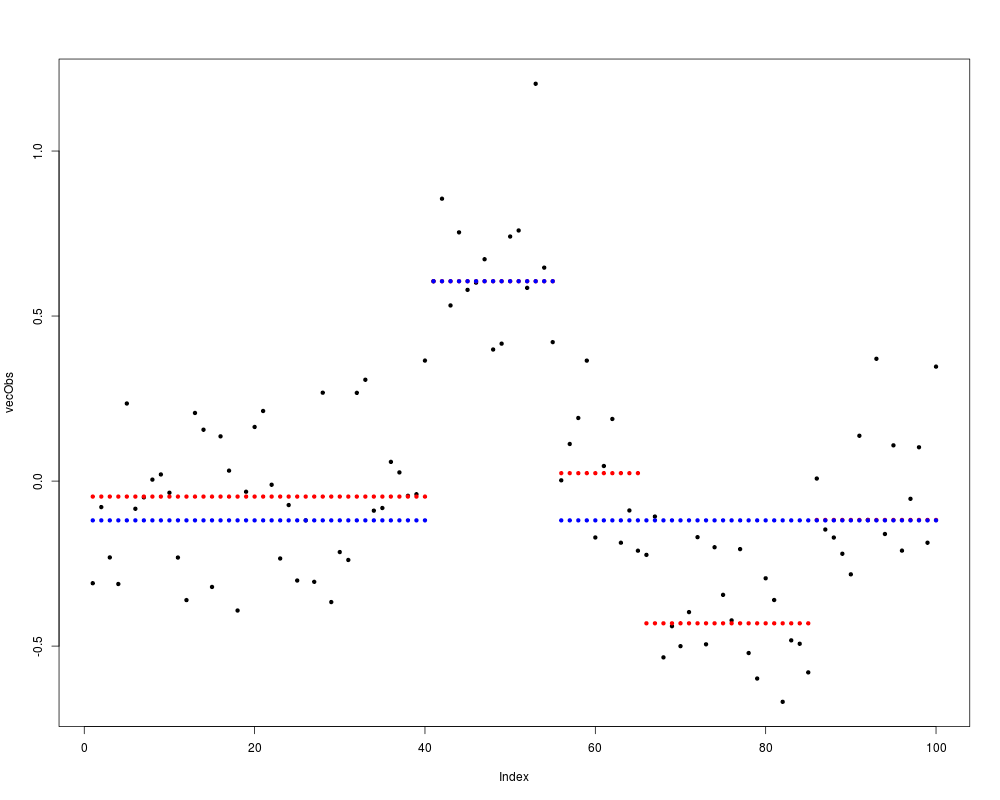
NotevecObs and vecPred must have same length and observed and predicted value for a given probe should have same position in vecObs and vedPred. The function assumes that log2-ratios are supplied Author(s)Hanni Willenbrock (Hanni@cbs.dtu.dk) and Jane Fridlyand (jfridlyand@cc.ucsf.edu) ReferencesWillenbrock H, Fridlyand J. (2005). A comparison study: applying segmentation to array CGH data for downstream analyses. Bioinformatics. 2005 Sep 14; [Epub ahead of print] Examples# Example data of observed and predicted log2-ratios vecObs <- c(rep(0,40),rep(0.6,15),rep(0,10),rep(-0.4,20),rep(0,15))+rnorm(100,sd=0.2) vecPred <- c(rep(median(vecObs[1:40]),40),rep(median(vecObs[41:55]),15), rep(median(vecObs[56:65]),10),rep(median(vecObs[66:85]),20),rep(median(vecObs[86:100]),15)) # Plot observed values (black) and predicted values (red) plot(vecObs,pch=20) points(vecPred,col="red",pch=20) # Run merge function merge.obj <- mergeLevels(vecObs,vecPred) # Add merged values to plot points(merge.obj$vecMerged,col="blue",pch=20) # Examine optimum threshold merge.obj$sq Results
R version 3.3.1 (2016-06-21) -- "Bug in Your Hair"
Copyright (C) 2016 The R Foundation for Statistical Computing
Platform: x86_64-pc-linux-gnu (64-bit)

R is free software and comes with ABSOLUTELY NO WARRANTY.
You are welcome to redistribute it under certain conditions.
Type 'license()' or 'licence()' for distribution details.

R is a collaborative project with many contributors.
Type 'contributors()' for more information and
'citation()' on how to cite R or R packages in publications.

Type 'demo()' for some demos, 'help()' for on-line help, or
'help.start()' for an HTML browser interface to help.
Type 'q()' to quit R.

> library(aCGH)
Loading required package: cluster
Loading required package: survival
Loading required package: multtest
Loading required package: BiocGenerics
Loading required package: parallel

Attaching package: 'BiocGenerics'

The following objects are masked from 'package:parallel':

    clusterApply, clusterApplyLB, clusterCall, clusterEvalQ,
    clusterExport, clusterMap, parApply, parCapply, parLapply,
    parLapplyLB, parRapply, parSapply, parSapplyLB

The following objects are masked from 'package:stats':

    IQR, mad, xtabs

The following objects are masked from 'package:base':

    Filter, Find, Map, Position, Reduce, anyDuplicated, append,
    as.data.frame, cbind, colnames, do.call, duplicated, eval, evalq,
    get, grep, grepl, intersect, is.unsorted, lapply, lengths, mapply,
    match, mget, order, paste, pmax, pmax.int, pmin, pmin.int, rank,
    rbind, rownames, sapply, setdiff, sort, table, tapply, union,
    unique, unsplit

Loading required package: Biobase
Welcome to Bioconductor

    Vignettes contain introductory material; view with
    'browseVignettes()'. To cite Bioconductor, see
    'citation("Biobase")', and for packages 'citation("pkgname")'.


Attaching package: 'aCGH'

The following object is masked from 'package:stats':

    heatmap

> png(filename="/home/ddbj/snapshot/RGM3/R_BC/result/aCGH/mergeLevels.Rd_%03d_medium.png", width=480, height=480)
> ### Name: mergeLevels
> ### Title: mergeLevels
> ### Aliases: mergeLevels combine.func
> ### Keywords: htest
>
> ### ** Examples
>
> # Example data of observed and predicted log2-ratios
> vecObs <- c(rep(0,40),rep(0.6,15),rep(0,10),rep(-0.4,20),rep(0,15))+rnorm(100,sd=0.2)
> vecPred <- c(rep(median(vecObs[1:40]),40),rep(median(vecObs[41:55]),15),
+   rep(median(vecObs[56:65]),10),rep(median(vecObs[66:85]),20),rep(median(vecObs[86:100]),15))
>
> # Plot observed values (black) and predicted values (red)
> plot(vecObs,pch=20)
> points(vecPred,col="red",pch=20)
>
> # Run merge function
> merge.obj <- mergeLevels(vecObs,vecPred)

Current thresAbs:  0.05

Current thresAbs:  0.09

Current thresAbs:  0.13

Current thresAbs:  0.17

Current thresAbs:  0.21

Current thresAbs:  0.25

Current thresAbs:  0.29

Current thresAbs:  0.33

Current thresAbs:  0.37

Current thresAbs:  0.41

Current thresAbs:  0.45

Current thresAbs:  0.49

Current thresAbs:  0.5
>
> # Add merged values to plot
> points(merge.obj$vecMerged,col="blue",pch=20)
>
> # Examine optimum threshold
> merge.obj$sq
 [1] 0.05 0.09 0.13 0.17 0.21 0.25 0.29 0.33 0.37 0.41 0.45 0.49 0.50
>
>
>
>
>
> dev.off()
null device
          1
>
|