Data frame having the same structure as the result of
applying mt.maxT or mt.minP functions
from Bioconductor's multtest package for multiple testing.
The result is a data frame including the following 4 components:
'index', 'teststat', 'rawp' and 'adjp'.
pheno
phenotype to compare.
chrominfo
Chromosomal information. Defaults to
human.chrom.info.Jul03
X
Include X chromosome? Defaults to yes.
Y
Include Y chromosome? Defaults to no.
rsp.uniq
rsp.uniq specified the codes for the groups of
interest. Default is the unique levels of the phenotype. Not used
when all is T.
all
all specifies whether samples should be analyzed by subgroups
(T) or together (F).
titles
titles names of the groups to be used. Default is the unique
levels of the pheno.
cutplot
only clones with at least cutplot frequency of
gain and loss are plotted.
thres
thres is either a vector providing unique
threshold for each sample or a vector of the same length as number
of samples (columns in data) providing sample-specific
threshold. If aCGH.obj has non-null sd.samples, then thres is automatically replaced by factor times madGenome of aCGH object. Clone is considered to be gained if it is above the
threshold and lost if it below negative threshold. Used for plotting
the gain/loss frequency data as well as for clone screening and for
significance analysis when threshold is TRUE.Defaults to 0.25
factor
factor specifies the number by which experimental variability should be multiplied. used only when sd.samples(aCGH.obj) is not NULL or when factor is greater than 0. Defaults to 2.5
ylm
ylm vertical limits for the plot
p.thres
p.thres vector of p-value ciut-off to be plotted. computed
conservatively as the threshold corresponding to a given adjusted
p-value.
numaut
numaut number of the autosomes
onepage
onepage whether all plots are to be plotted on one page or
different pages. When more than 2 groups are compared, we recommend multiple pages.
colored
Is plotting in color or not? Default is TRUE.
Examples
data(colorectal)
## Use mt.maxT function from multtest package to test
## differences in group means for each clone grouped by sex
colnames(phenotype(colorectal))
sex <- phenotype(colorectal)$sex
sex.na <- !is.na(sex)
colorectal.na <- colorectal[ ,sex.na, keep = TRUE ]
dat <- log2.ratios.imputed(colorectal.na)
resT.sex <- mt.maxT(dat, sex[sex.na], test = "t", B = 1000)
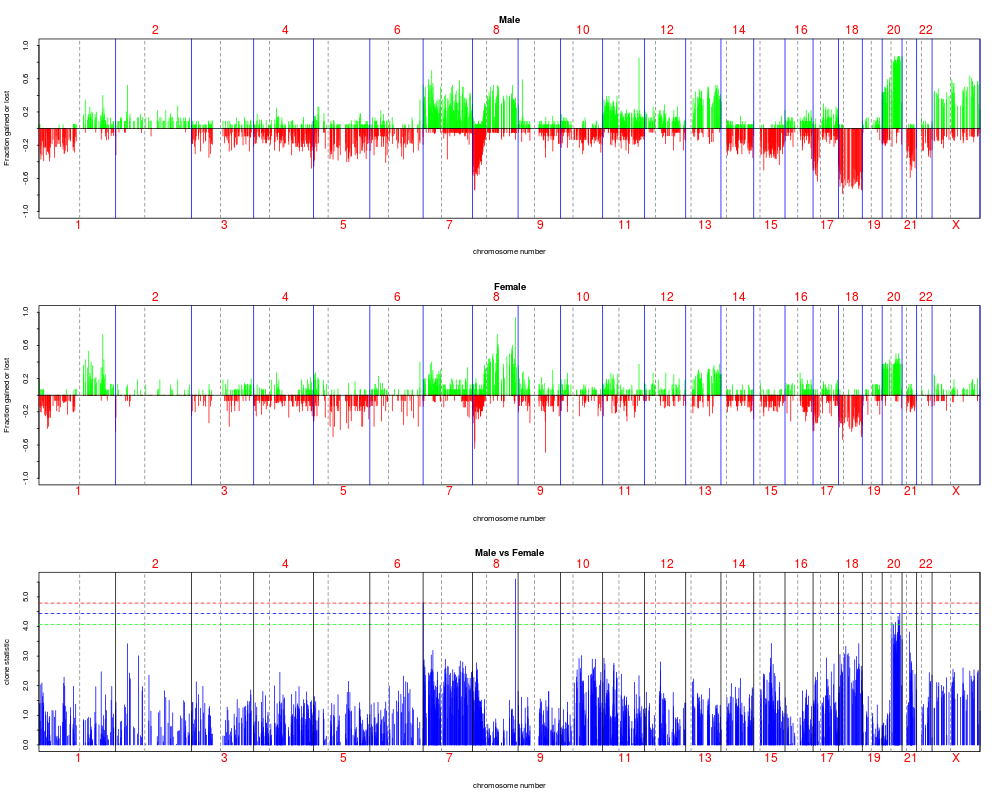
## Plot the result along the genome
plotFreqStat(colorectal.na, resT.sex, sex[sex.na],
titles = c("Male", "Female"))
## Adjust the p.values from previous exercise with "fdr"
## method and plot them
resT.sex.fdr <- resT.sex
resT.sex.fdr$adjp <- p.adjust(resT.sex.fdr$rawp, "fdr")
plotFreqStat(colorectal.na, resT.sex.fdr, sex[sex.na],
titles = c("Male", "Female"))
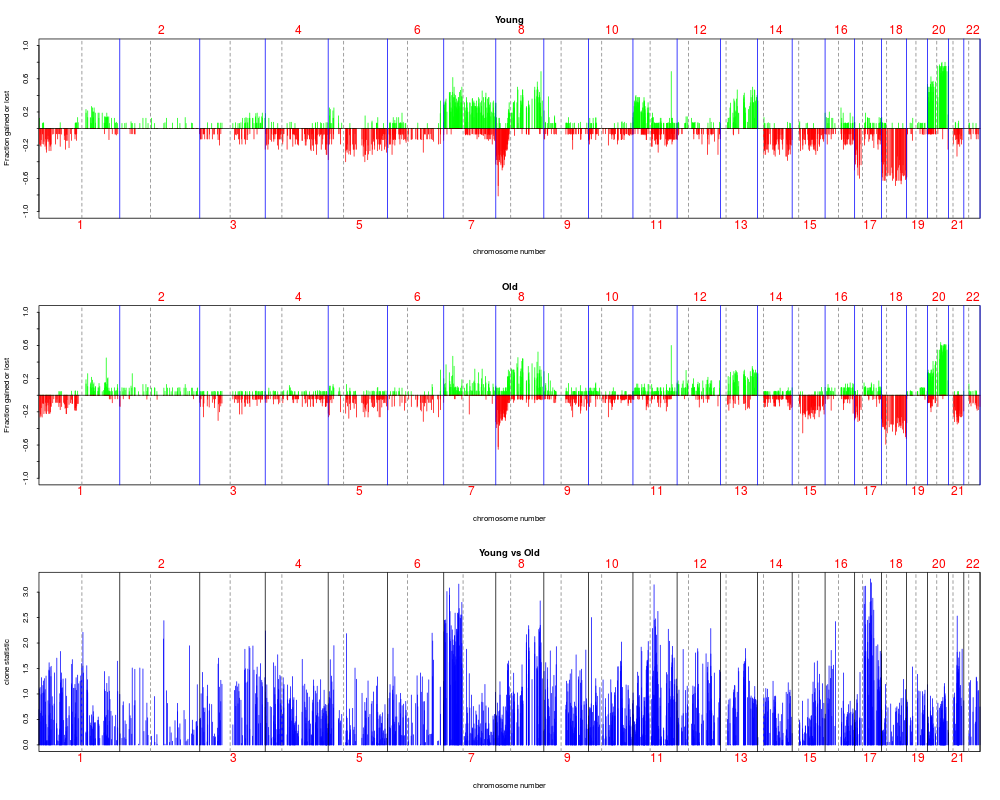
## Derive statistics and p-values for testing the linear association of
## age with the log2 ratios of each clone along the samples
age <- phenotype(colorectal)$age
age.na <- which(!is.na(age))
age <- age[age.na]
colorectal.na <- colorectal[, age.na]
stat.age <- aCGH.test(colorectal.na, age, test = "linear.regression", p.adjust.method = "fdr")
#separate into two groups: < 70 and > 70 and plot freqeuncies of gain and loss
#for each clone. Note that statistic plotted corresponds to linear coefficient
#for age variable
plotFreqStat(colorectal.na, stat.age, ifelse(age < 70, 0, 1), titles =
c("Young", "Old"), X = FALSE, Y = FALSE)
Results
R version 3.3.1 (2016-06-21) -- "Bug in Your Hair"
Copyright (C) 2016 The R Foundation for Statistical Computing
Platform: x86_64-pc-linux-gnu (64-bit)

R is free software and comes with ABSOLUTELY NO WARRANTY.
You are welcome to redistribute it under certain conditions.
Type 'license()' or 'licence()' for distribution details.

R is a collaborative project with many contributors.
Type 'contributors()' for more information and
'citation()' on how to cite R or R packages in publications.

Type 'demo()' for some demos, 'help()' for on-line help, or
'help.start()' for an HTML browser interface to help.
Type 'q()' to quit R.

> library(aCGH)
Loading required package: cluster
Loading required package: survival
Loading required package: multtest
Loading required package: BiocGenerics
Loading required package: parallel

Attaching package: 'BiocGenerics'

The following objects are masked from 'package:parallel':

    clusterApply, clusterApplyLB, clusterCall, clusterEvalQ,
    clusterExport, clusterMap, parApply, parCapply, parLapply,
    parLapplyLB, parRapply, parSapply, parSapplyLB

The following objects are masked from 'package:stats':

    IQR, mad, xtabs

The following objects are masked from 'package:base':

    Filter, Find, Map, Position, Reduce, anyDuplicated, append,
    as.data.frame, cbind, colnames, do.call, duplicated, eval, evalq,
    get, grep, grepl, intersect, is.unsorted, lapply, lengths, mapply,
    match, mget, order, paste, pmax, pmax.int, pmin, pmin.int, rank,
    rbind, rownames, sapply, setdiff, sort, table, tapply, union,
    unique, unsplit

Loading required package: Biobase
Welcome to Bioconductor

    Vignettes contain introductory material; view with
    'browseVignettes()'. To cite Bioconductor, see
    'citation("Biobase")', and for packages 'citation("pkgname")'.


Attaching package: 'aCGH'

The following object is masked from 'package:stats':

    heatmap

> png(filename="/home/ddbj/snapshot/RGM3/R_BC/result/aCGH/plotFreqStat.Rd_%03d_medium.png", width=480, height=480)
> ### Name: plotFreqStat
> ### Title: frequency plots and significance analysis
> ### Aliases: plotFreqStat changeProp.func changeProp.overall.func
> ###   table.bac.func lengthGain.na propGain.na lengthLoss.na propLoss.na
> ###   prop.na create.resT plotFreqStatColors plotFreqStatGrey
> ###   plotFreqGivenStat plotfreqGivenStatFinalColors
> ###   plotfreq.stat.final.func plotfreq.stat.chrom.final.func
> ###   plotfreq.givenstat.final.colors.func
> ### Keywords: htest hplot
>
> ### ** Examples
>
>
> data(colorectal)
>
> ## Use mt.maxT function from multtest package to test
> ## differences in group means for each clone grouped by sex
> colnames(phenotype(colorectal))
 [1] "id"      "age"     "sex"     "stage"   "loc"     "hist"    "diff"
 [8] "gstm1"   "gstt1"   "nqo"     "K12"     "K13"     "MTHFR"   "ERCC1"
[15] "bat26"   "bat25"   "D5S346"  "D17S250" "D2S123"  "mi2"     "LOH"
[22] "k12"     "K12AA"   "k13"     "K13AA"   "M677"    "M1298"   "p16"
[29] "p14"     "mlh1"    "BAT26"   "mlh1c"   "mi"      "misum"   "CGHSTAT"
> sex <- phenotype(colorectal)$sex
> sex.na <- !is.na(sex)
> colorectal.na <- colorectal[ ,sex.na, keep = TRUE ]
> dat <- log2.ratios.imputed(colorectal.na)
> resT.sex <- mt.maxT(dat, sex[sex.na], test = "t", B = 1000)
b=10	b=20	b=30	b=40	b=50	b=60	b=70	b=80	b=90	b=100
b=110	b=120	b=130	b=140	b=150	b=160	b=170	b=180	b=190	b=200
b=210	b=220	b=230	b=240	b=250	b=260	b=270	b=280	b=290	b=300
b=310	b=320	b=330	b=340	b=350	b=360	b=370	b=380	b=390	b=400
b=410	b=420	b=430	b=440	b=450	b=460	b=470	b=480	b=490	b=500
b=510	b=520	b=530	b=540	b=550	b=560	b=570	b=580	b=590	b=600
b=610	b=620	b=630	b=640	b=650	b=660	b=670	b=680	b=690	b=700
b=710	b=720	b=730	b=740	b=750	b=760	b=770	b=780	b=790	b=800
b=810	b=820	b=830	b=840	b=850	b=860	b=870	b=880	b=890	b=900
b=910	b=920	b=930	b=940	b=950	b=960	b=970	b=980	b=990	b=1000
>
> ## Plot the result along the genome
> plotFreqStat(colorectal.na, resT.sex, sex[sex.na],
+              titles = c("Male", "Female"))
>
> ## Adjust the p.values from previous exercise with "fdr"
> ## method and plot them
> resT.sex.fdr <- resT.sex
> resT.sex.fdr$adjp <- p.adjust(resT.sex.fdr$rawp, "fdr")
> plotFreqStat(colorectal.na, resT.sex.fdr, sex[sex.na],
+              titles = c("Male", "Female"))
>
> ## Derive statistics and p-values for testing the linear association of
> ## age with the log2 ratios of each clone along the samples
>
> age <- phenotype(colorectal)$age
> age.na <- which(!is.na(age))
> age <- age[age.na]
> colorectal.na <- colorectal[, age.na]
Warning message:
In `[.aCGH`(colorectal, , age.na) : subsetting the log2.ratios only
> stat.age <- aCGH.test(colorectal.na, age, test = "linear.regression", p.adjust.method = "fdr")
>
> #separate into two groups: < 70 and > 70 and plot freqeuncies of gain and loss
> #for each clone. Note that statistic plotted corresponds to linear coefficient
> #for age variable
>
> plotFreqStat(colorectal.na, stat.age, ifelse(age < 70, 0, 1), titles =
+              c("Young", "Old"), X = FALSE, Y = FALSE)
>
>
>
>
>
> dev.off()
null device
          1
>
 .
.