Supported by Dr. Osamu Ogasawara and  . . |
|
Last data update: 2014.03.03 |
Plotting the estimated hmm states and log2 ratios for each sample.DescriptionThis function displays the estimated hmm states and log2 ratios for each sample. Usage
plotHmmStates(aCGH.obj, sample.ind, chr = 1:num.chromosomes(aCGH.obj),
             statesres = hmm.merged(aCGH.obj), maxChrom = 23,
             chrominfo = human.chrom.info.Jul03, yScale = c(-2, 2),
             samplenames = sample.names(aCGH.obj))
Arguments
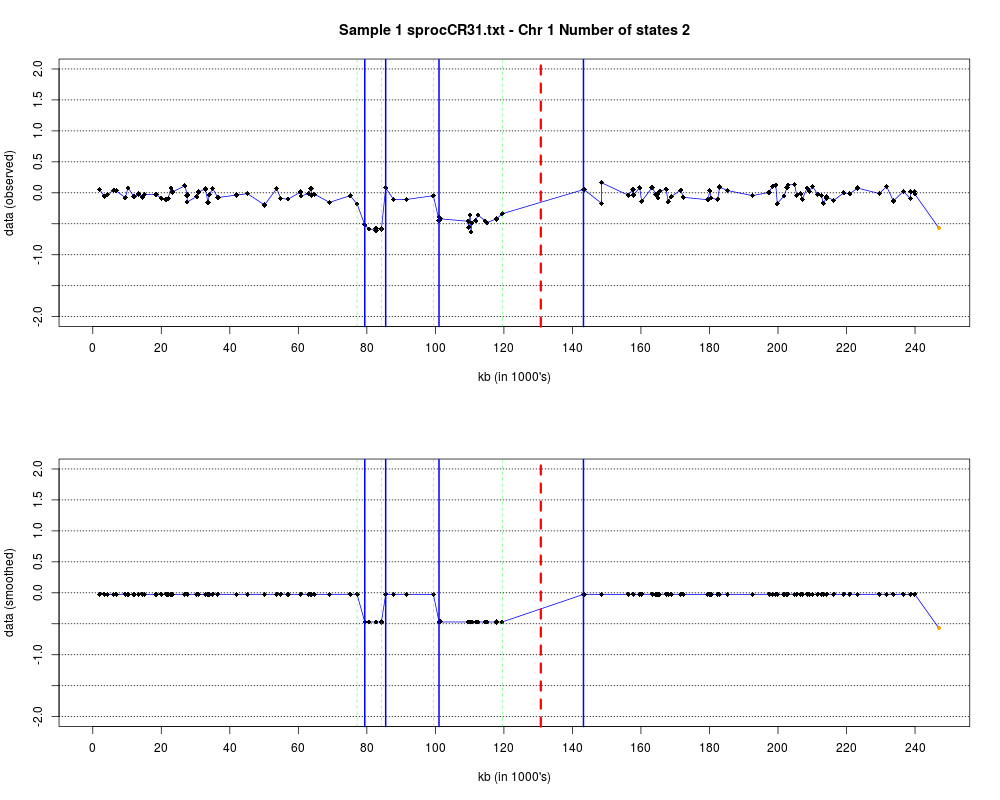
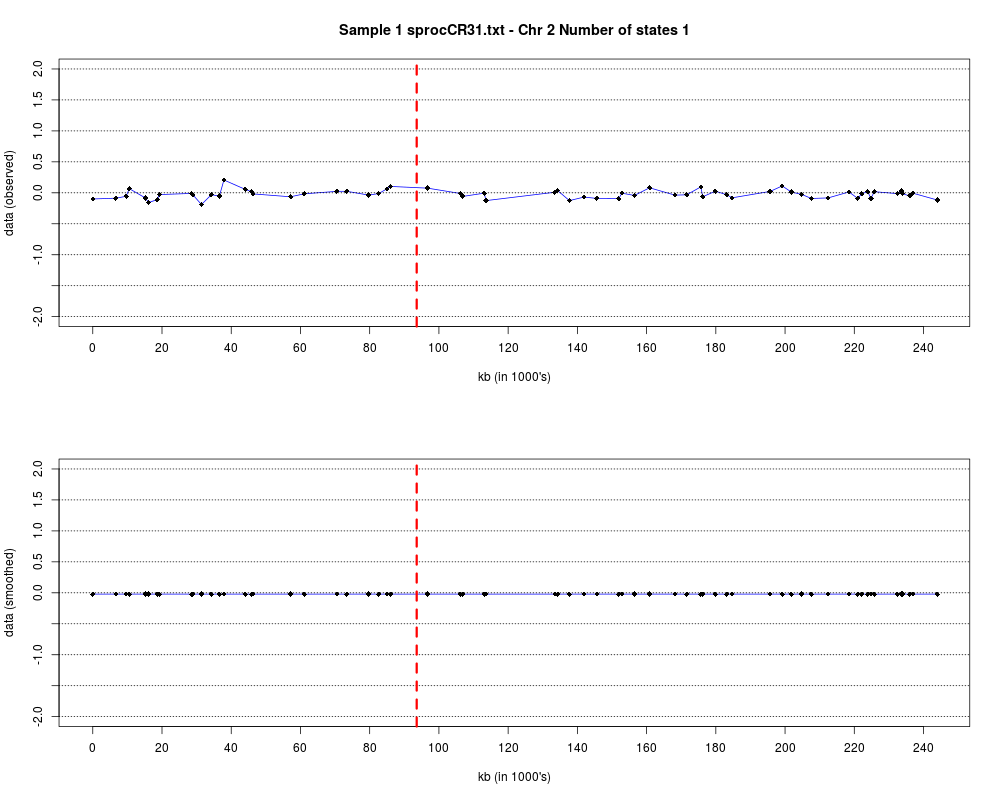
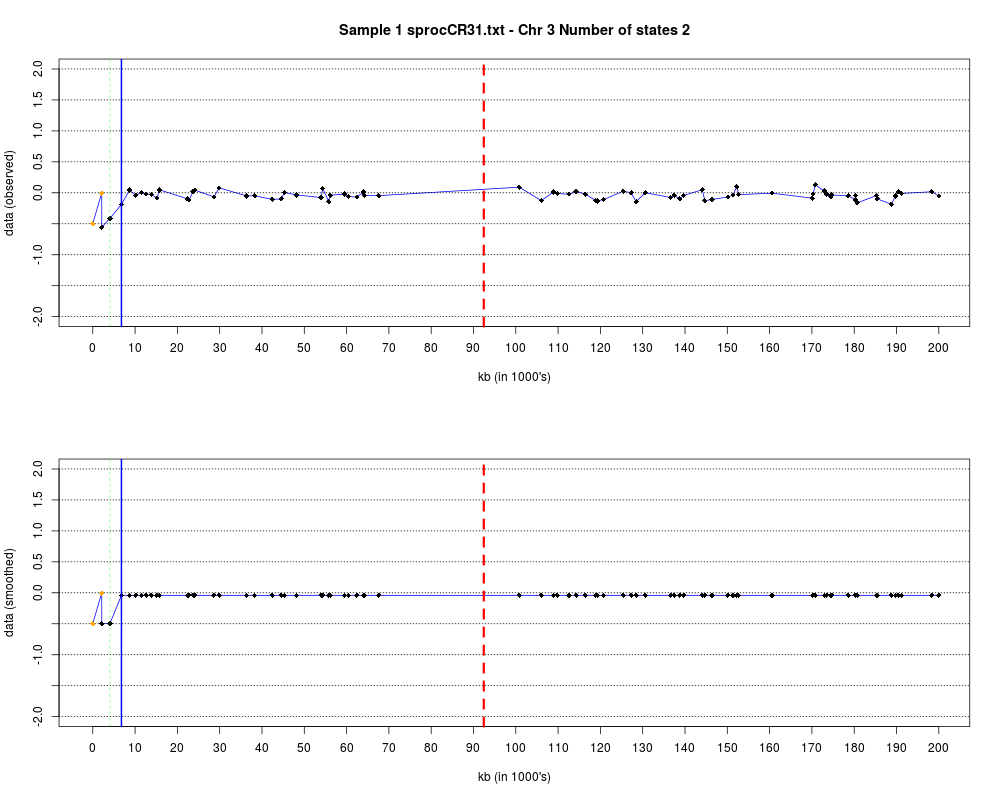
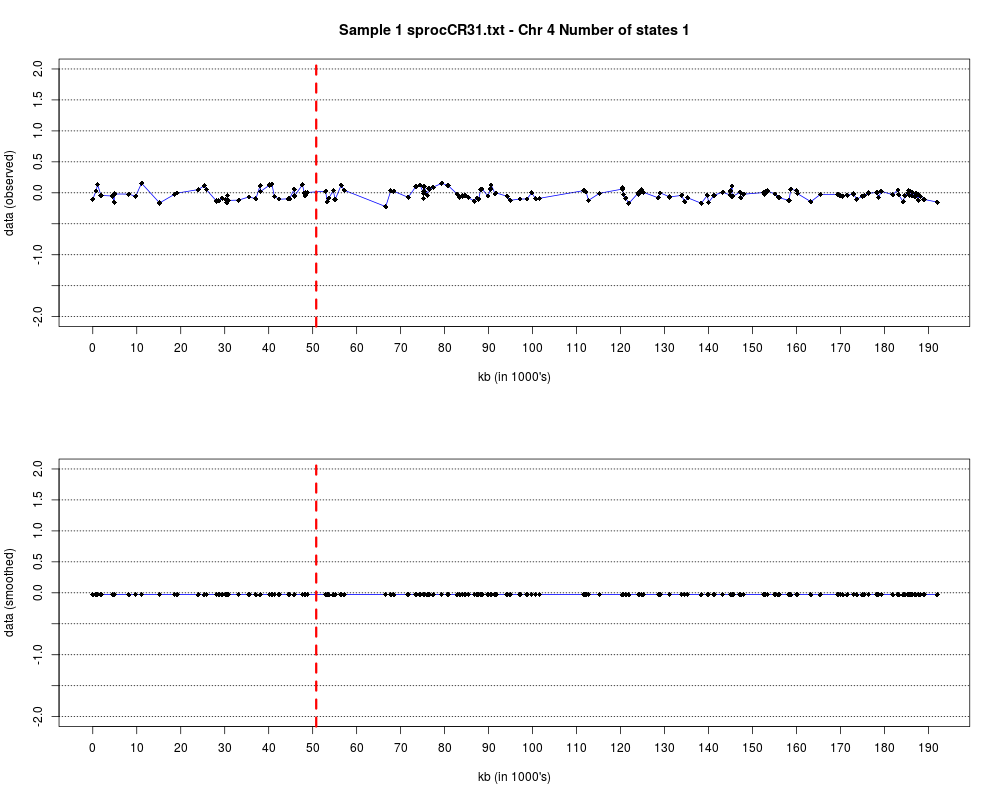
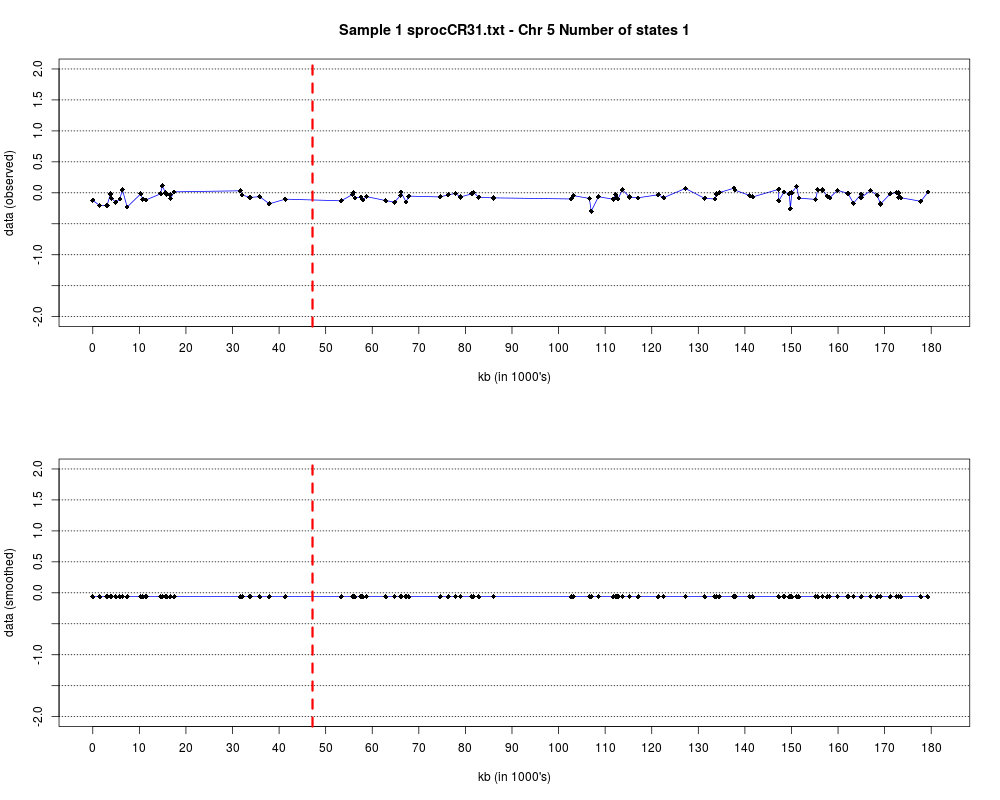
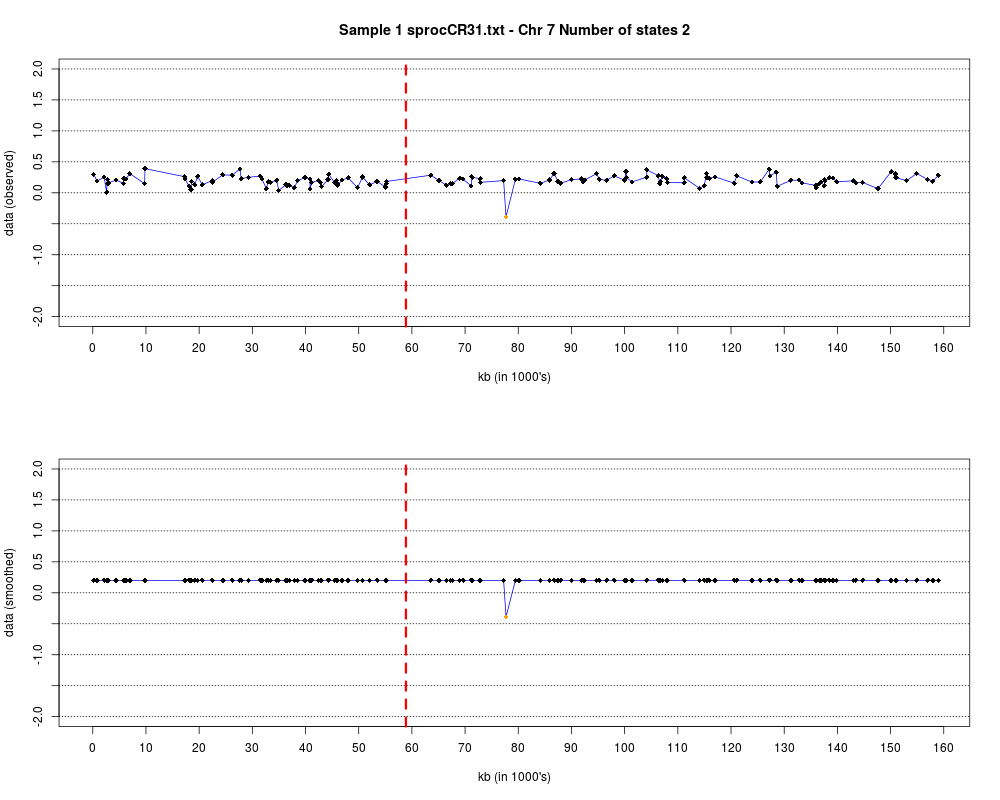
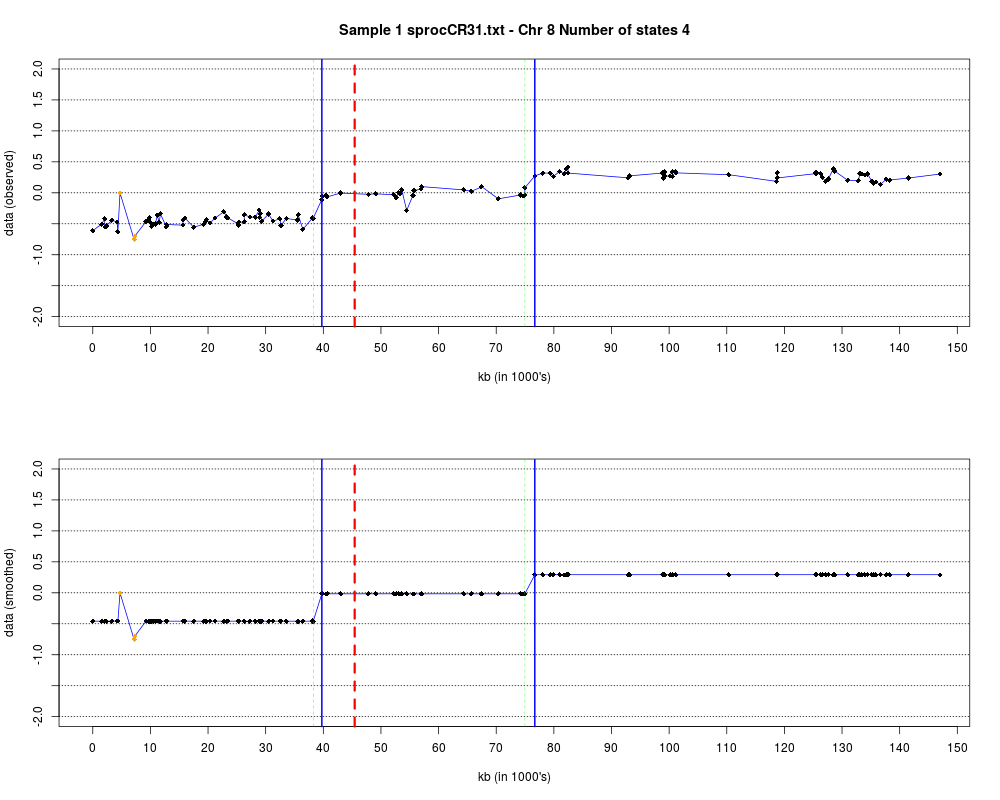
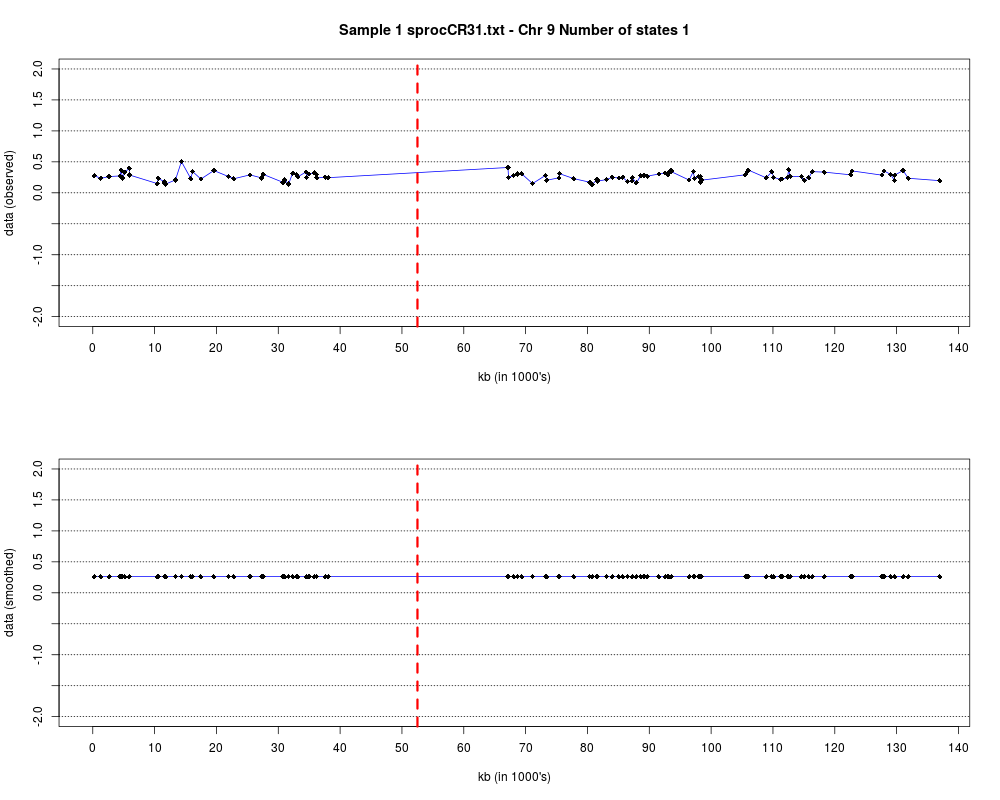
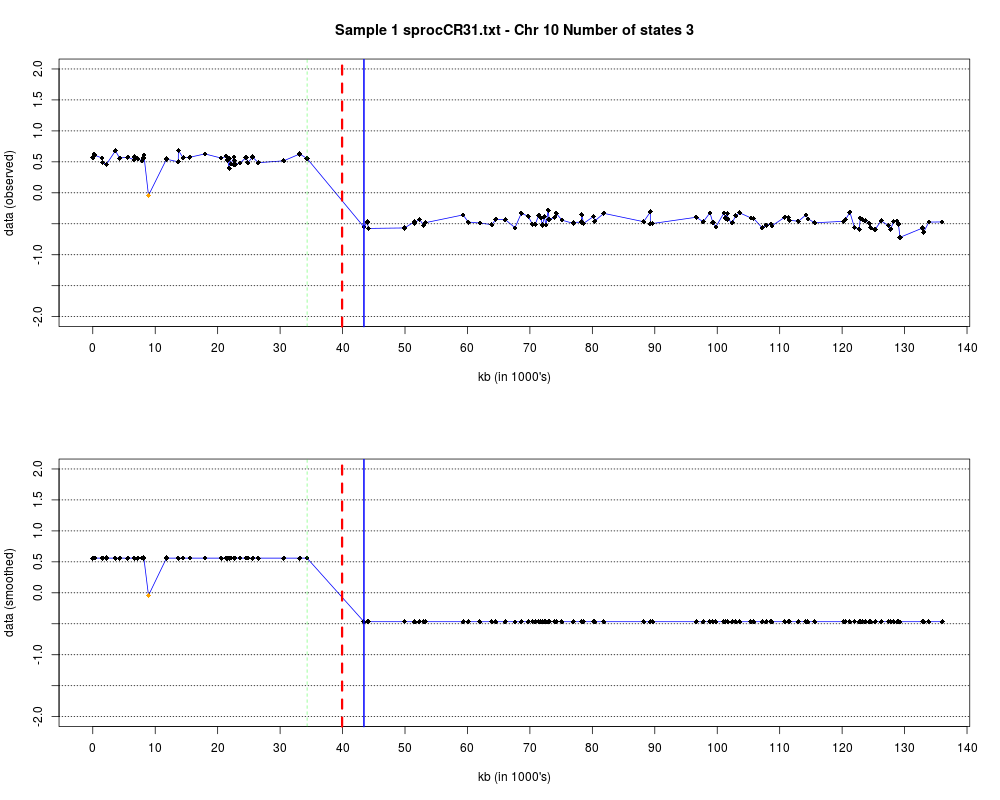
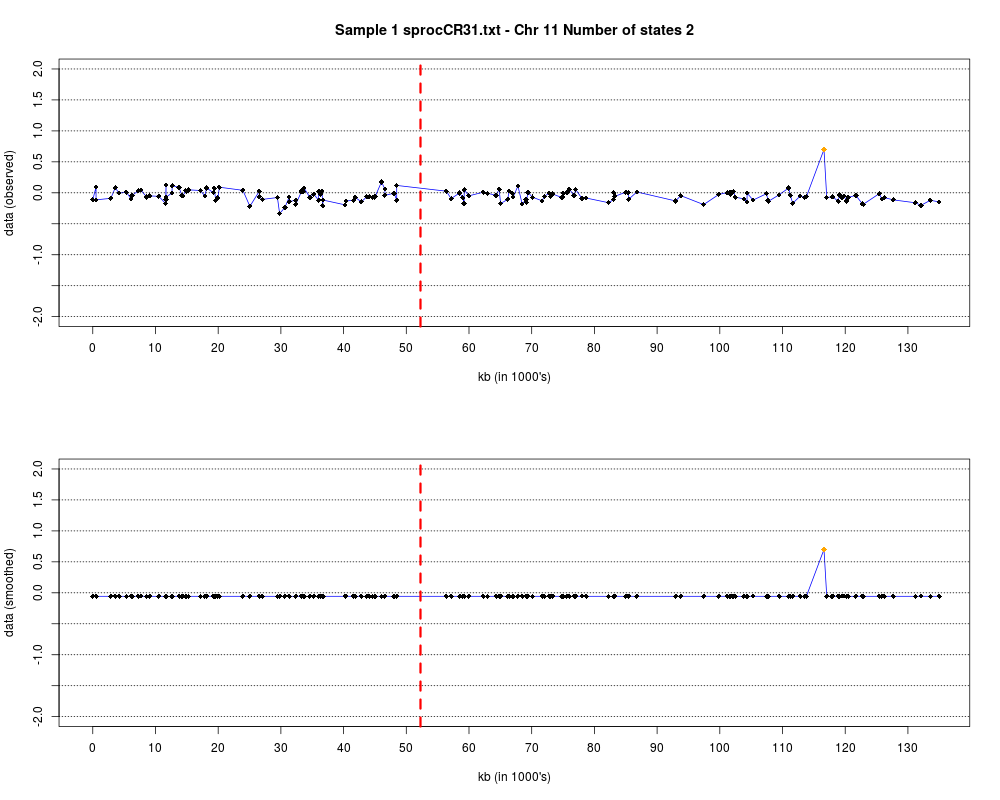
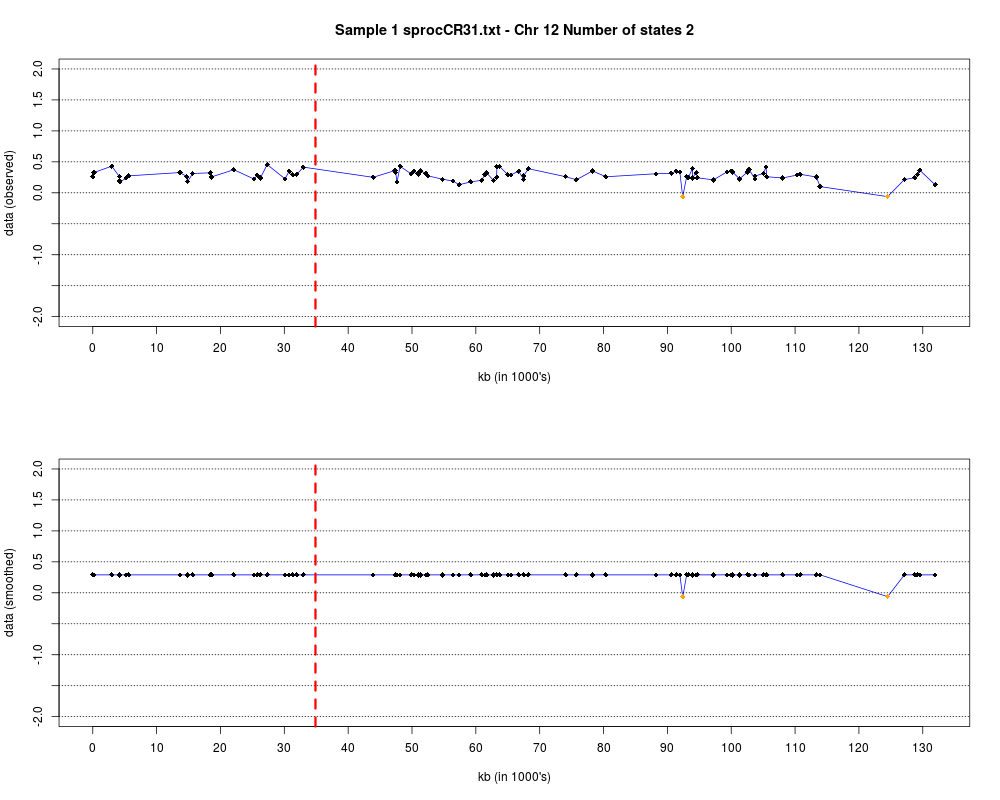
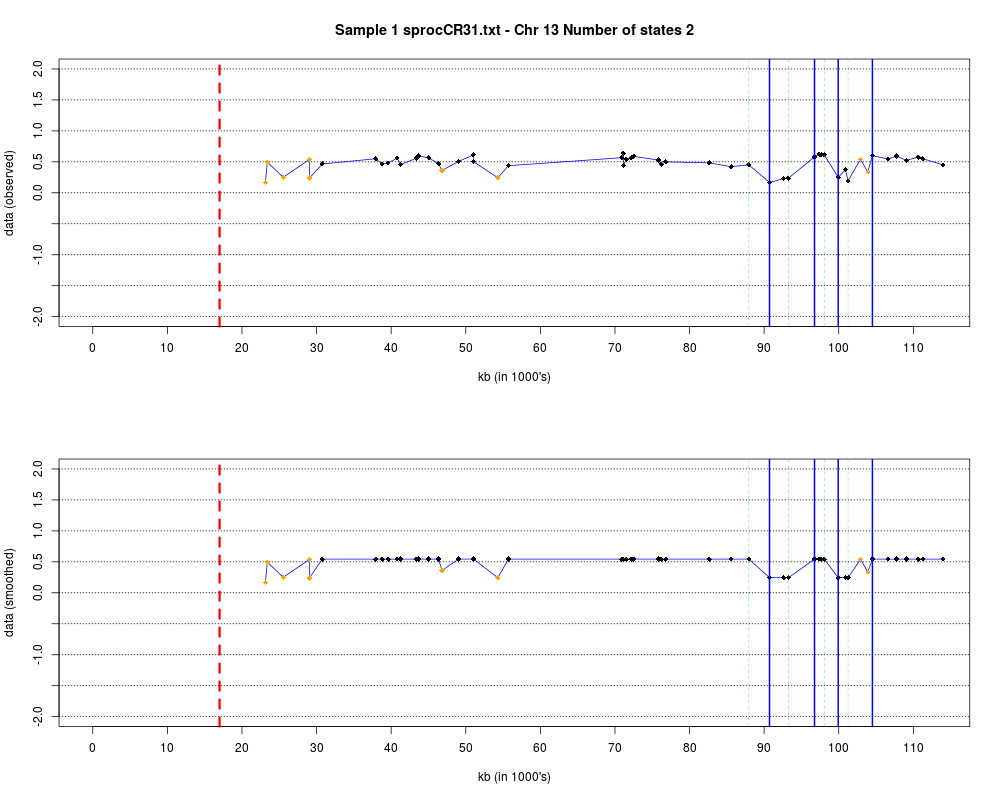
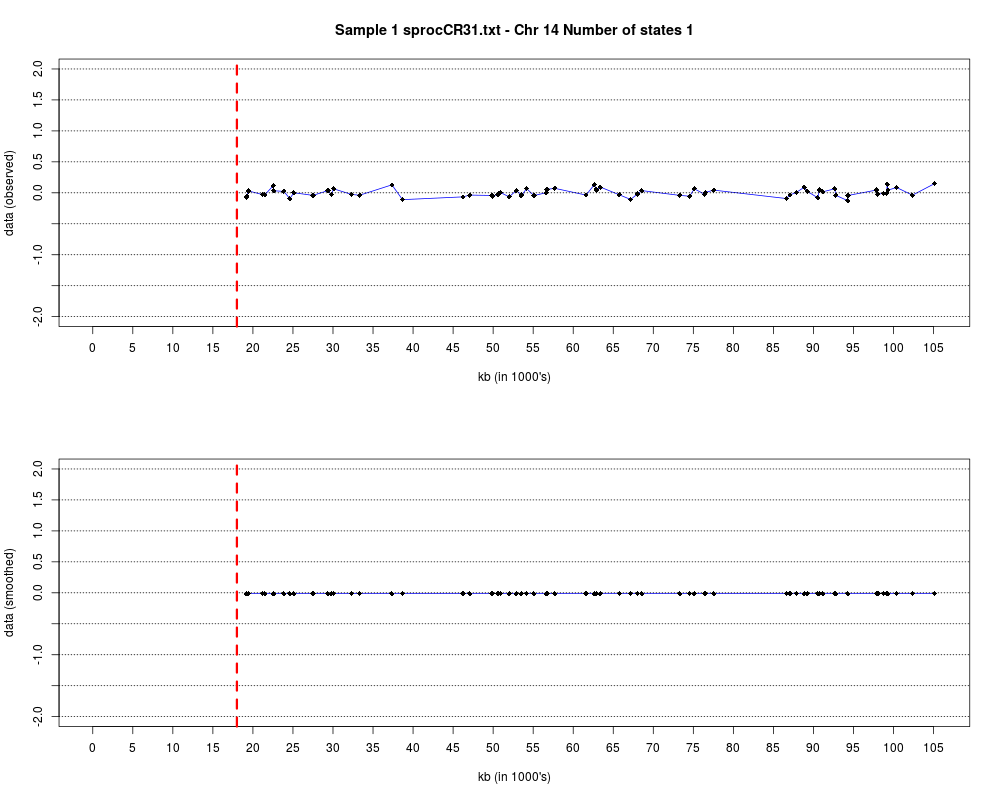
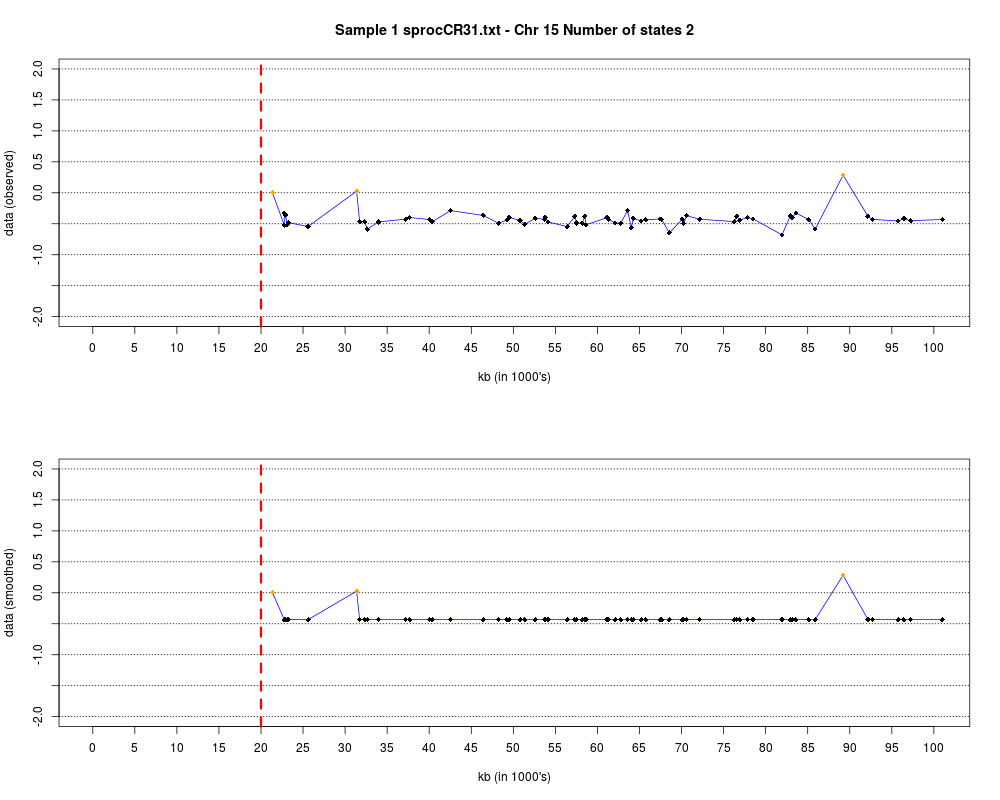
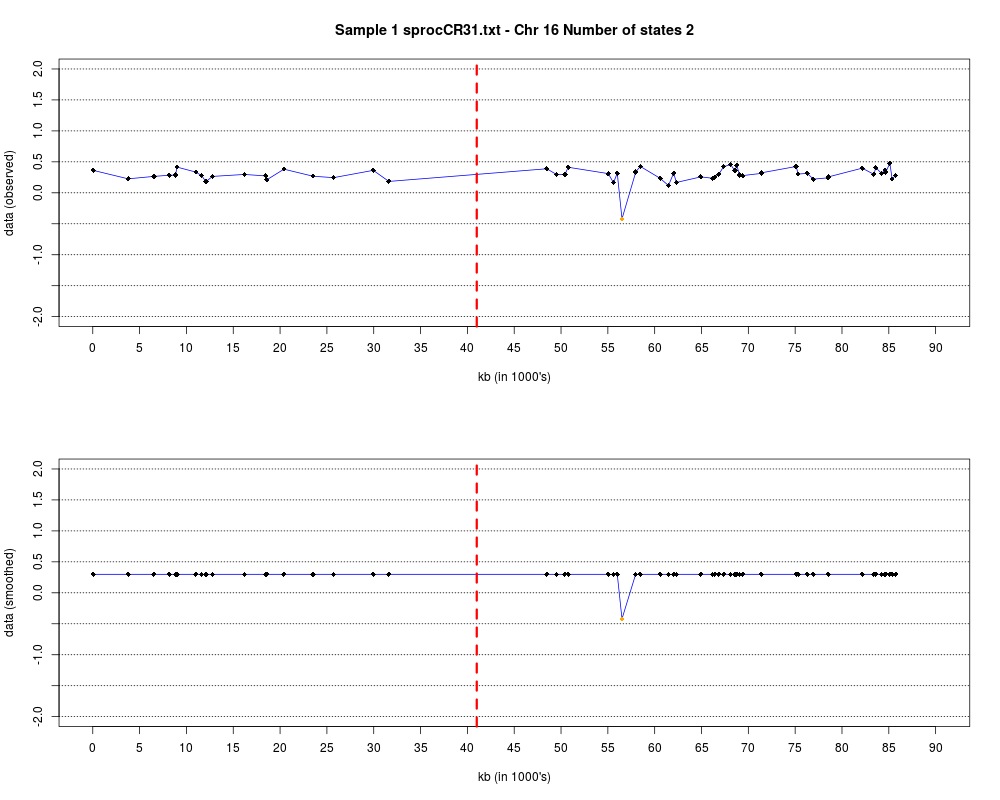
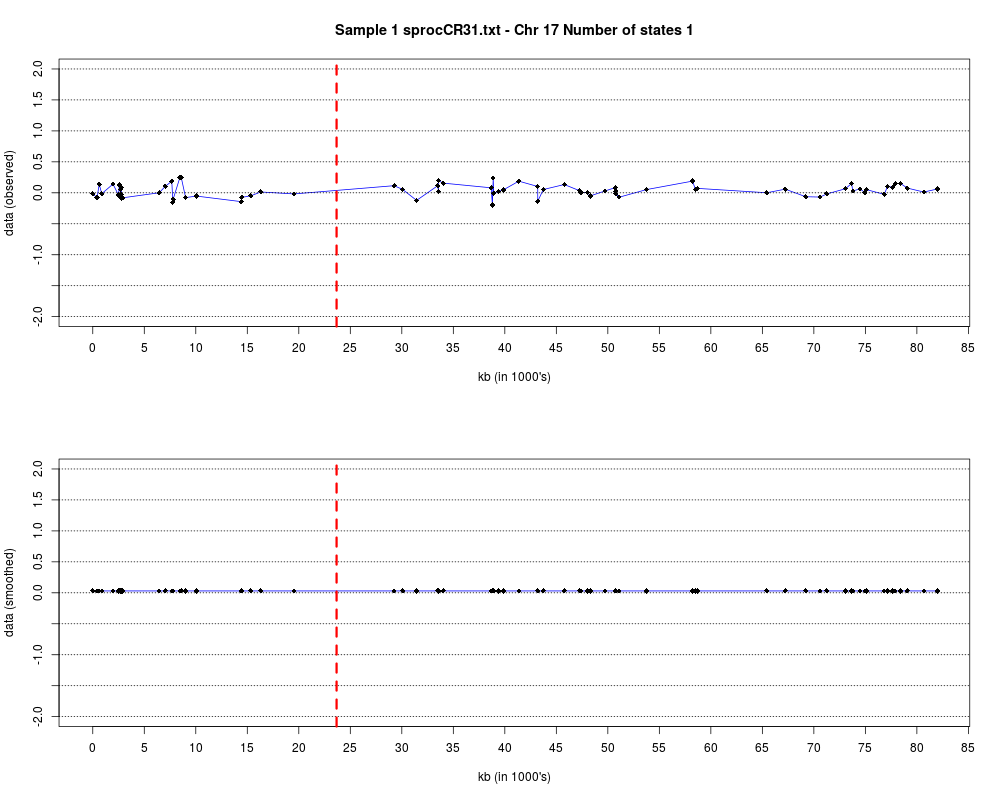
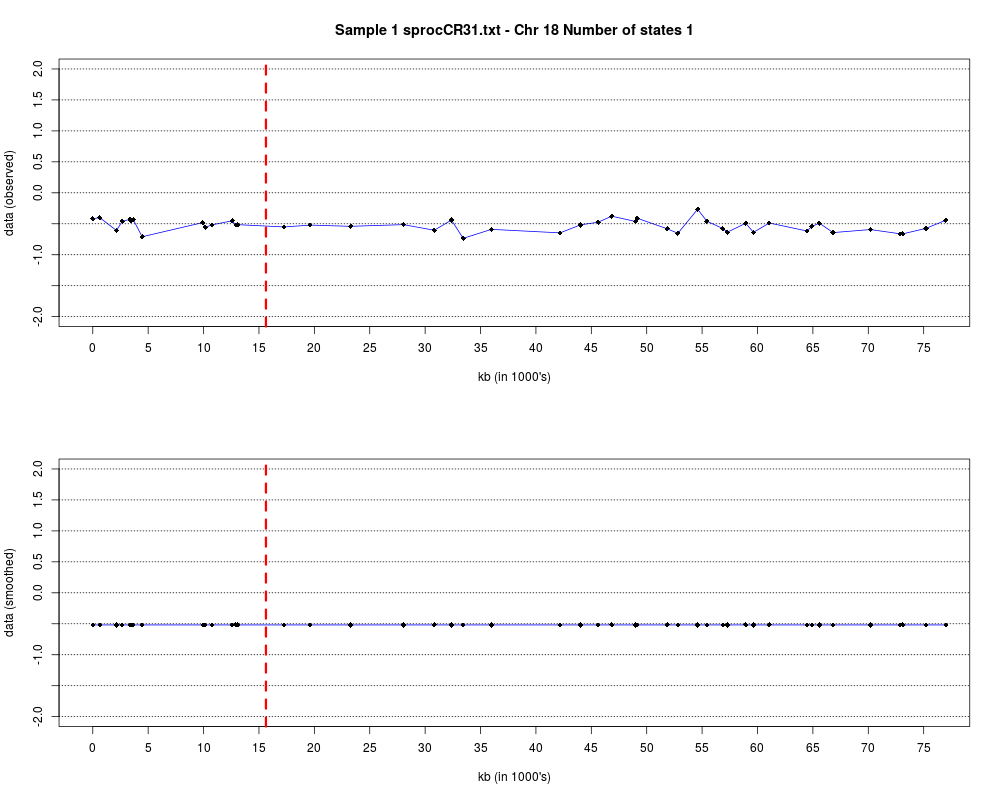
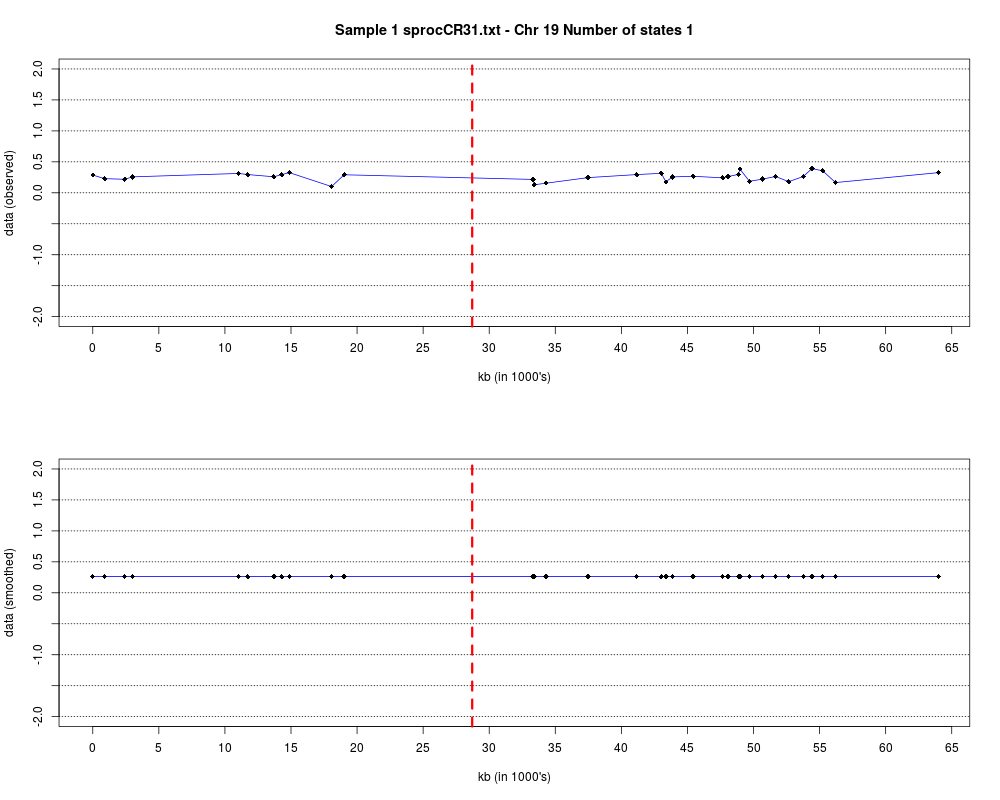
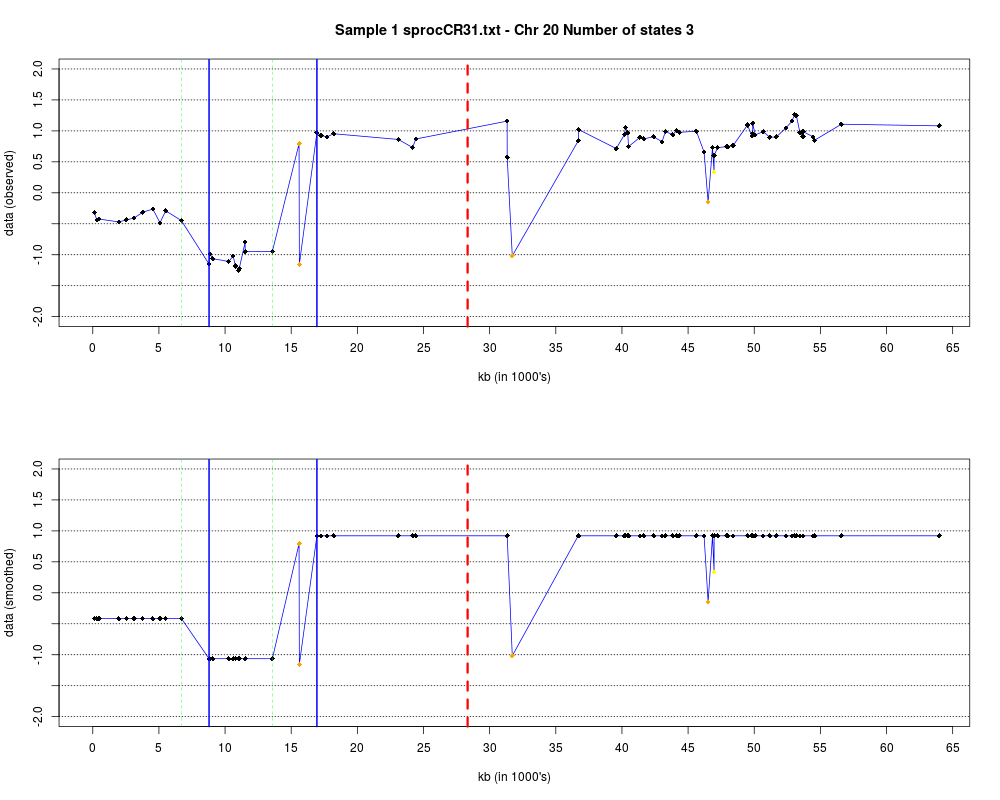
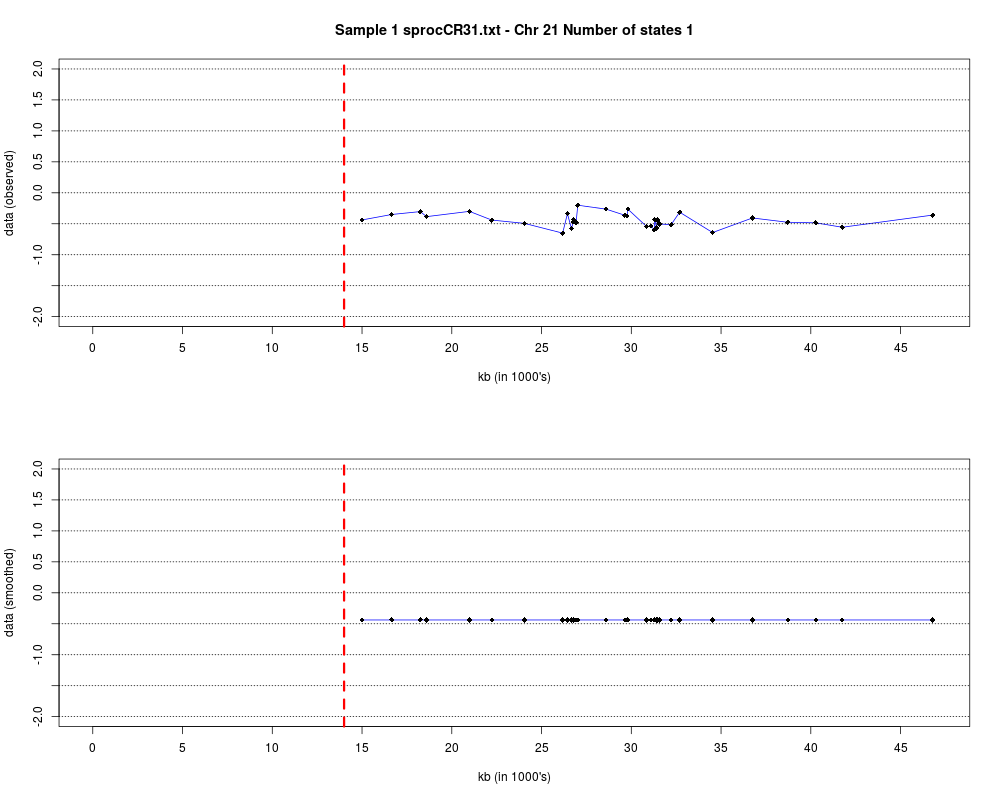
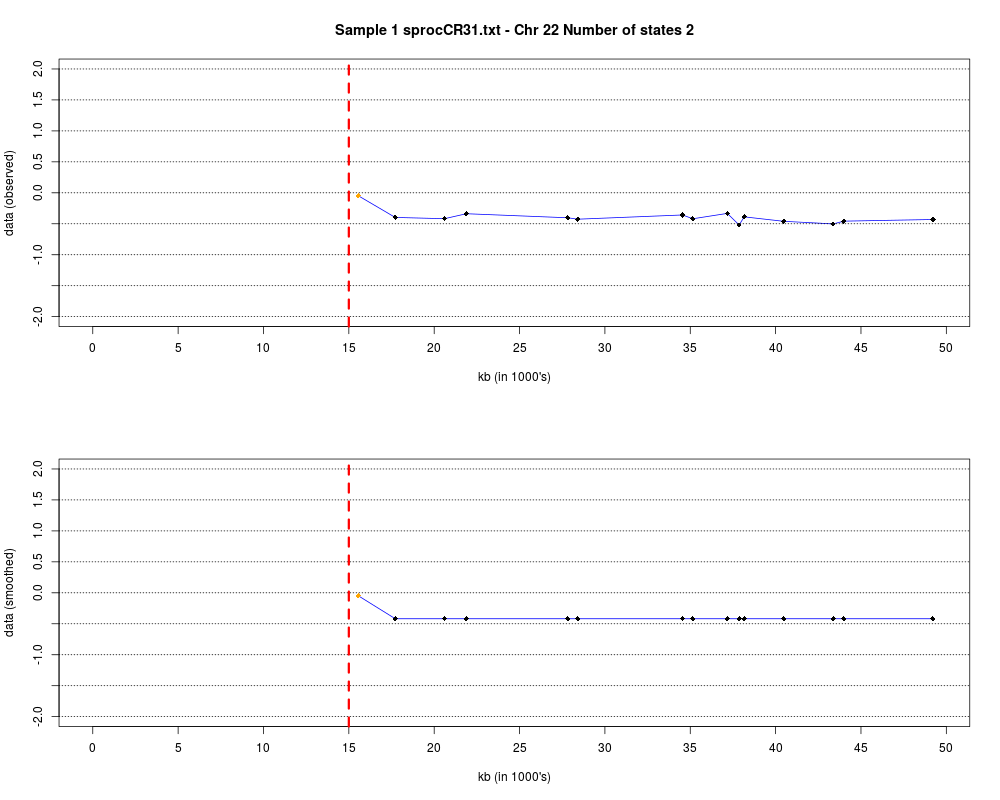
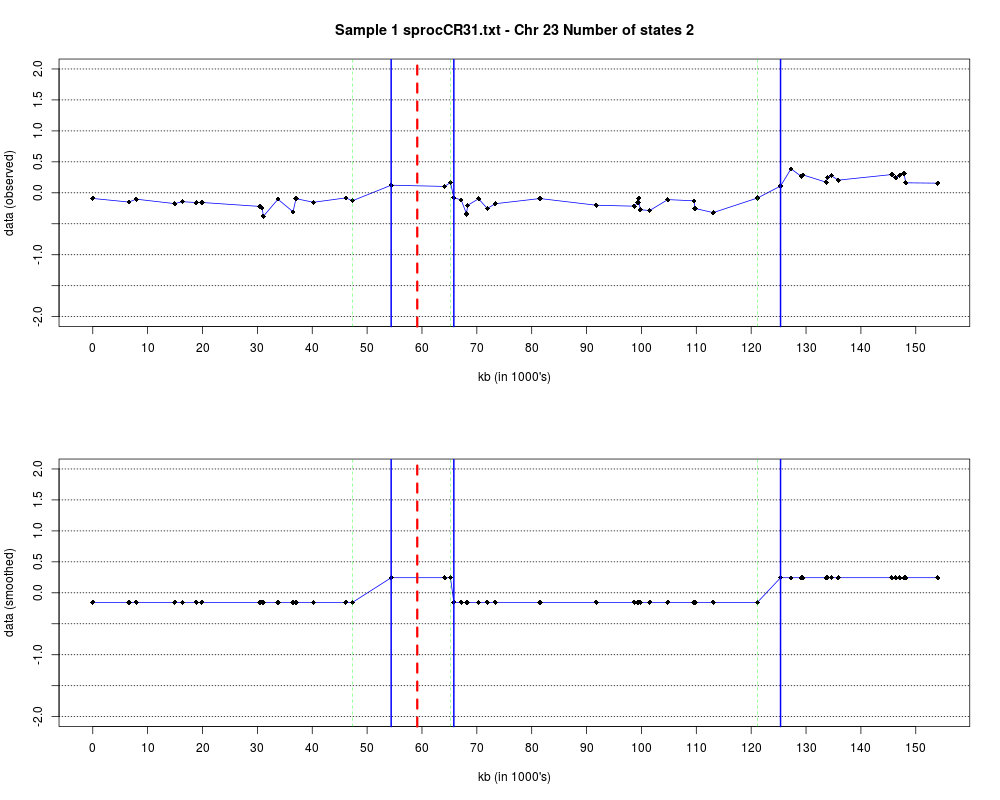
DetailsEach chromosome is plotted on a separate page and contains two figures. The top figure shows the observed log2ratios and the bottom figure shows predicted values for all clones but outliers which show observed values. The genomic events are indicated on both figures as following. The first clone after transition is indicated with solid blue line and the last clone after transitions is shown with dotted green line. Focal aberrations clones are colored orange, amplifications are colored red and outliers are yellow. Author(s)Jane Fridlyand ReferencesApplication of Hidden Markov Models to the analysis of the array CGH data, Fridlyand et.al., JMVA, 2004 See Also
Examplesdata(colorectal) plotHmmStates(colorectal, 1) Results
R version 3.3.1 (2016-06-21) -- "Bug in Your Hair"
Copyright (C) 2016 The R Foundation for Statistical Computing
Platform: x86_64-pc-linux-gnu (64-bit)

R is free software and comes with ABSOLUTELY NO WARRANTY.
You are welcome to redistribute it under certain conditions.
Type 'license()' or 'licence()' for distribution details.

R is a collaborative project with many contributors.
Type 'contributors()' for more information and
'citation()' on how to cite R or R packages in publications.

Type 'demo()' for some demos, 'help()' for on-line help, or
'help.start()' for an HTML browser interface to help.
Type 'q()' to quit R.

> library(aCGH)
Loading required package: cluster
Loading required package: survival
Loading required package: multtest
Loading required package: BiocGenerics
Loading required package: parallel

Attaching package: 'BiocGenerics'

The following objects are masked from 'package:parallel':

    clusterApply, clusterApplyLB, clusterCall, clusterEvalQ,
    clusterExport, clusterMap, parApply, parCapply, parLapply,
    parLapplyLB, parRapply, parSapply, parSapplyLB

The following objects are masked from 'package:stats':

    IQR, mad, xtabs

The following objects are masked from 'package:base':

    Filter, Find, Map, Position, Reduce, anyDuplicated, append,
    as.data.frame, cbind, colnames, do.call, duplicated, eval, evalq,
    get, grep, grepl, intersect, is.unsorted, lapply, lengths, mapply,
    match, mget, order, paste, pmax, pmax.int, pmin, pmin.int, rank,
    rbind, rownames, sapply, setdiff, sort, table, tapply, union,
    unique, unsplit

Loading required package: Biobase
Welcome to Bioconductor

    Vignettes contain introductory material; view with
    'browseVignettes()'. To cite Bioconductor, see
    'citation("Biobase")', and for packages 'citation("pkgname")'.


Attaching package: 'aCGH'

The following object is masked from 'package:stats':

    heatmap

> png(filename="/home/ddbj/snapshot/RGM3/R_BC/result/aCGH/plotHmmStates.Rd_%03d_medium.png", width=480, height=480)
> ### Name: plotHmmStates
> ### Title: Plotting the estimated hmm states and log2 ratios for each
> ###   sample.
> ### Aliases: plotHmmStates plotHmmStatesNew
> ### Keywords: hplot
>
> ### ** Examples
>
>
> data(colorectal)
> plotHmmStates(colorectal, 1)
>
>
>
>
>
>
> dev.off()
null device
          1
>
|