phenotype to compare. defaults to all the samples being analyzed
together.
titles
titles for the groups, defaults to the name of the response
X
logical indicating whether X needs to be shown
Y
logical indicating whether Y needs to be shown
maxChrom
this parameter controls how many chromosomes will be
plotted, from 1 to maxChrom
chrominfo
a chromosomal information associated with the mapping of the data
num.plots.per.page
number of frequency plots per page. Default is the number of
groups
factor
factor specifies the number by which experimental variability should be multiples. Used only when tumor specific variability in aCGH.obj is not NULL. Defaults to 2.5
posThres
Threshold for gain. Set very high for homozygous deletion
negThres
Threshold for homozygous deletion
Details
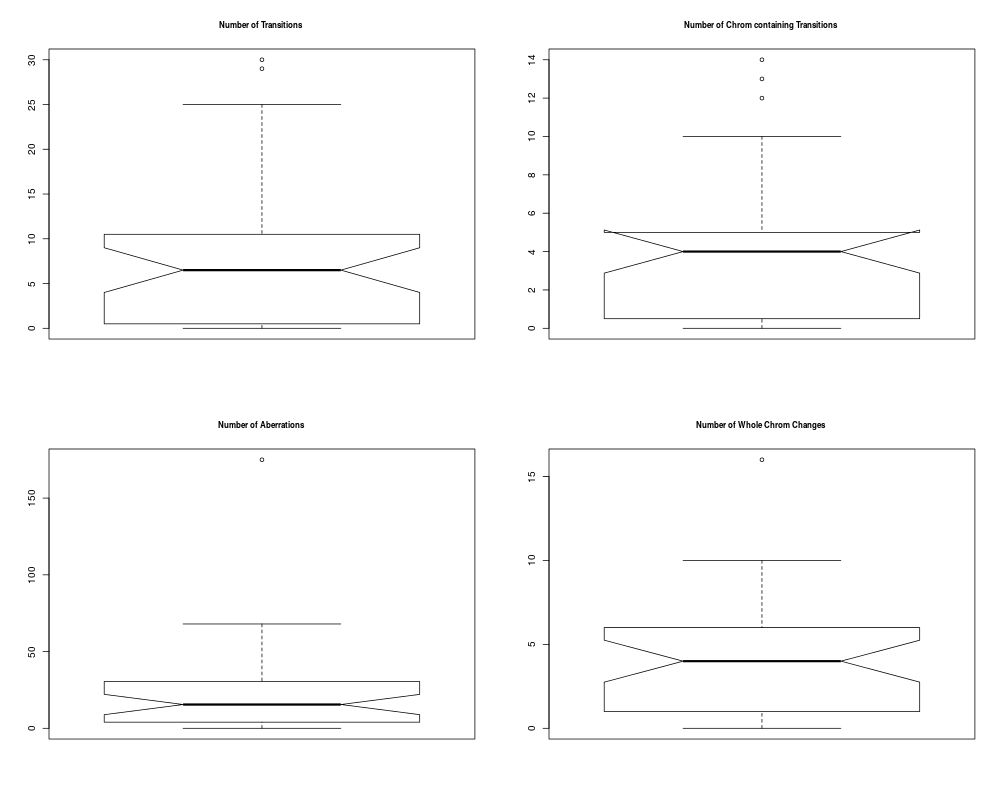
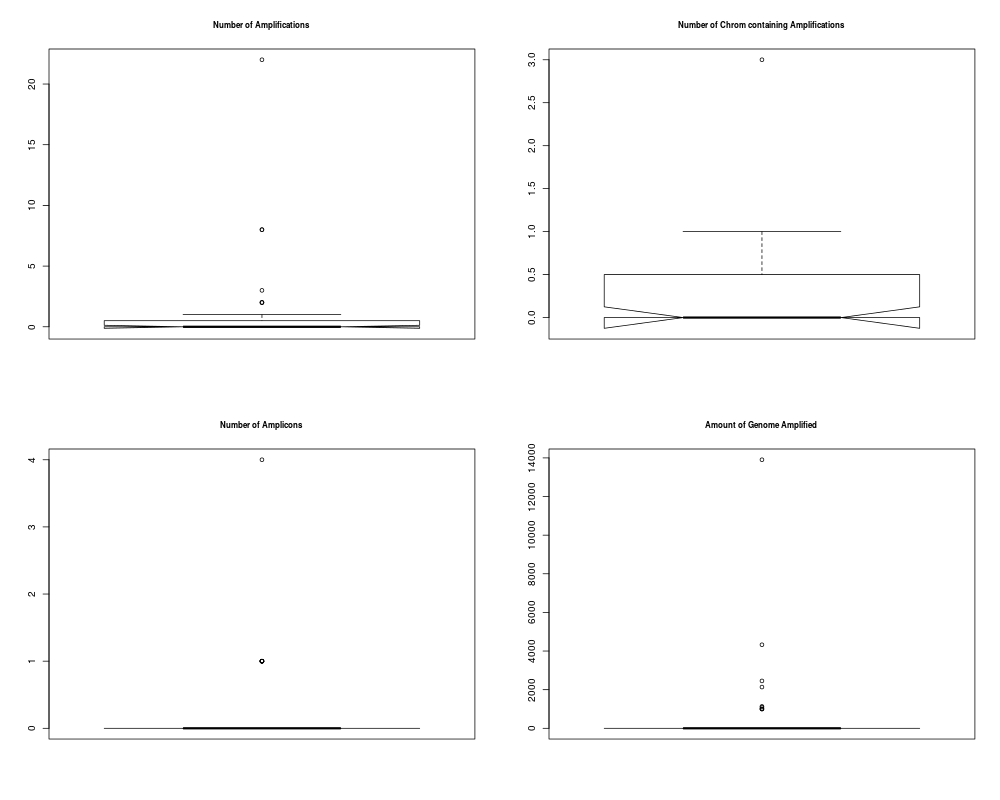
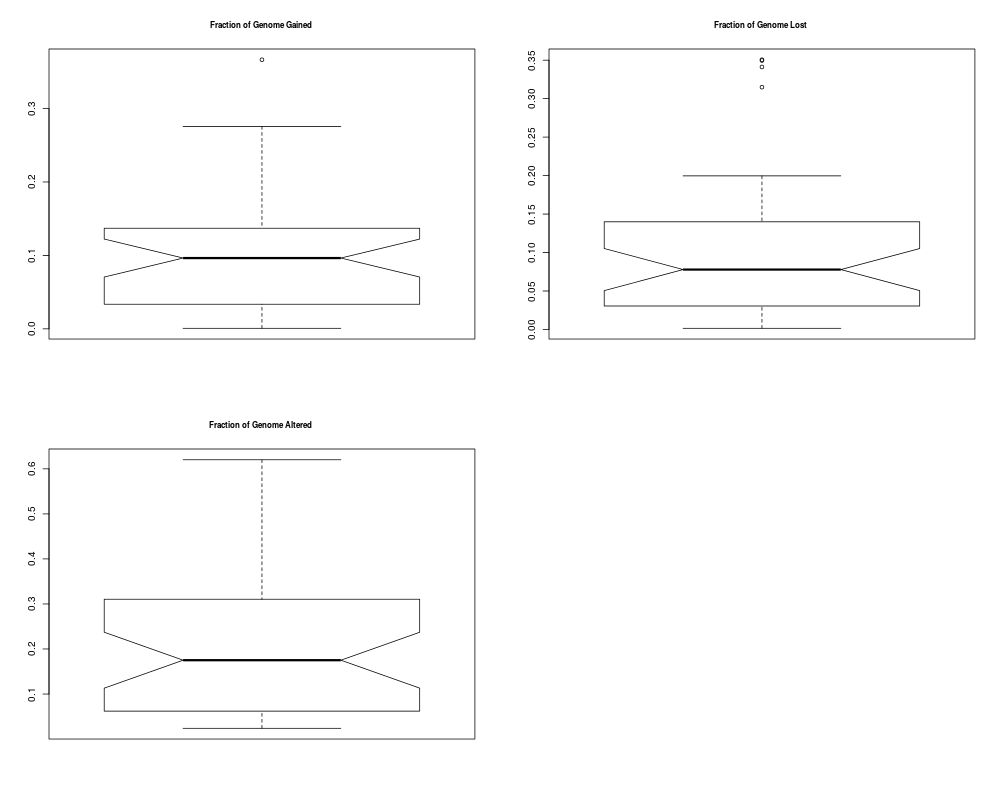
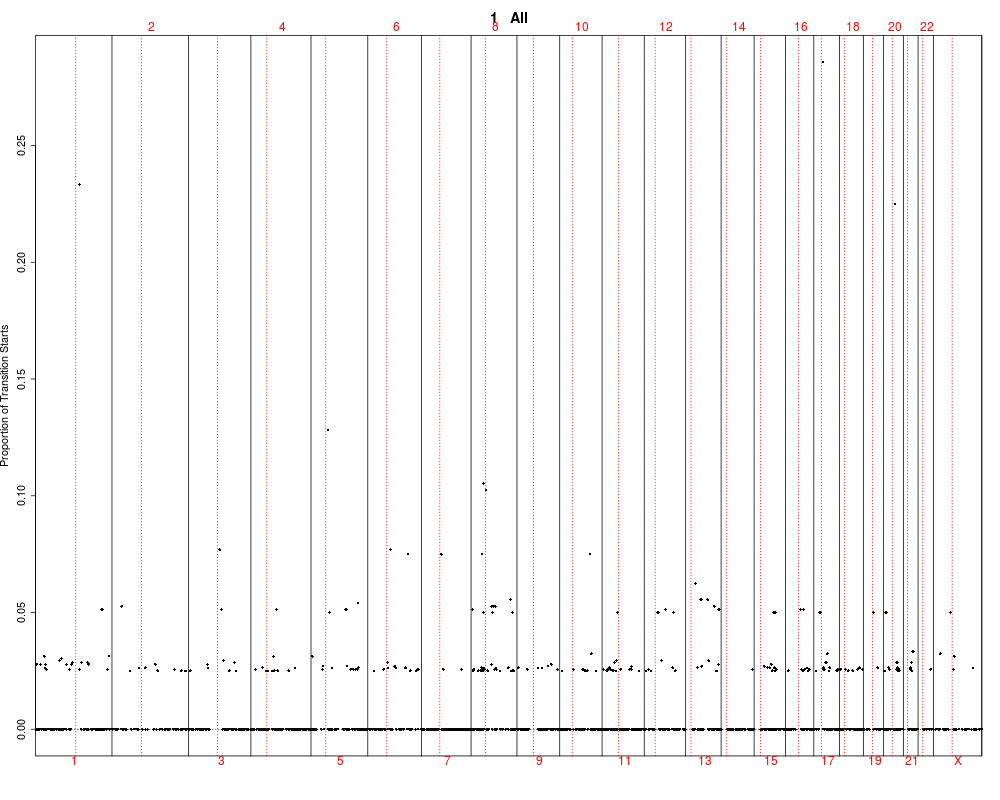
This function utilizes output of the find.genomic.events
by plotting it and testing between groups. The test are performed
using kruskal-wallis rank test.
See Also
aCGHfind.genomic.events
Examples
data(colorectal)
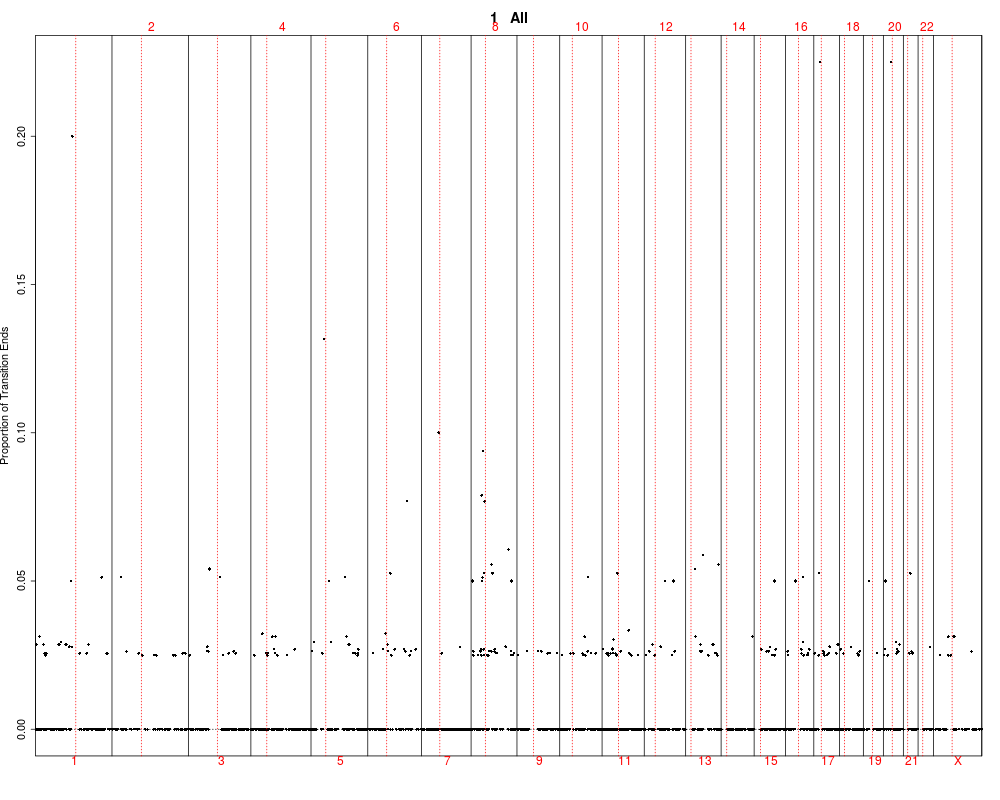
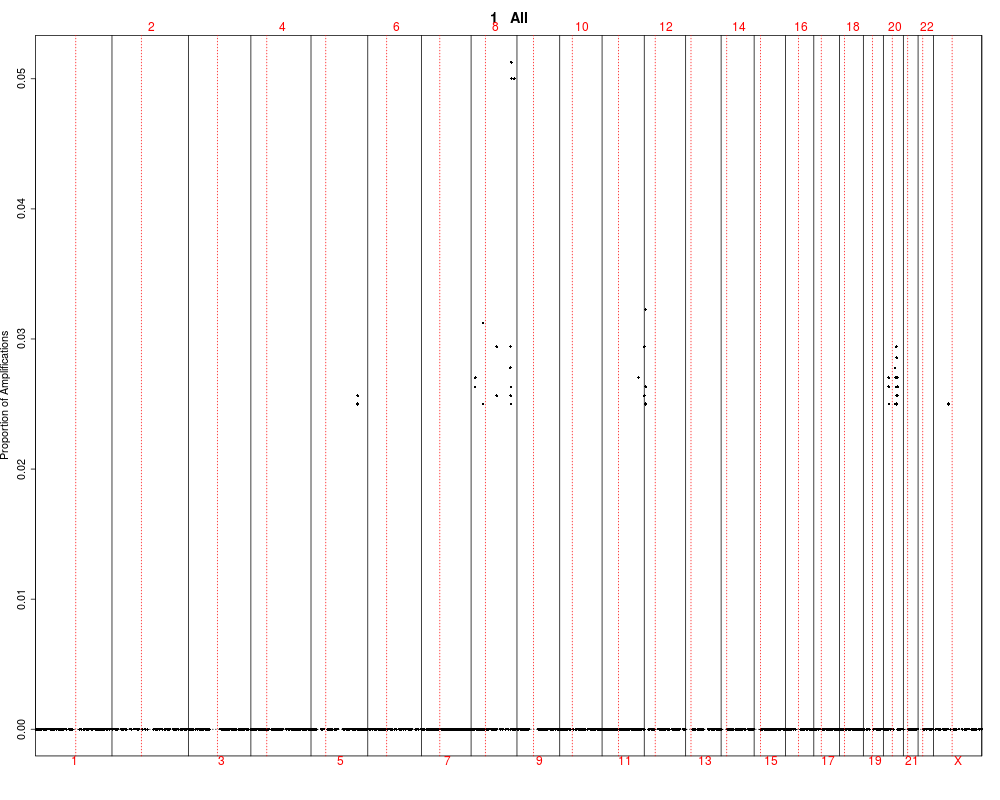
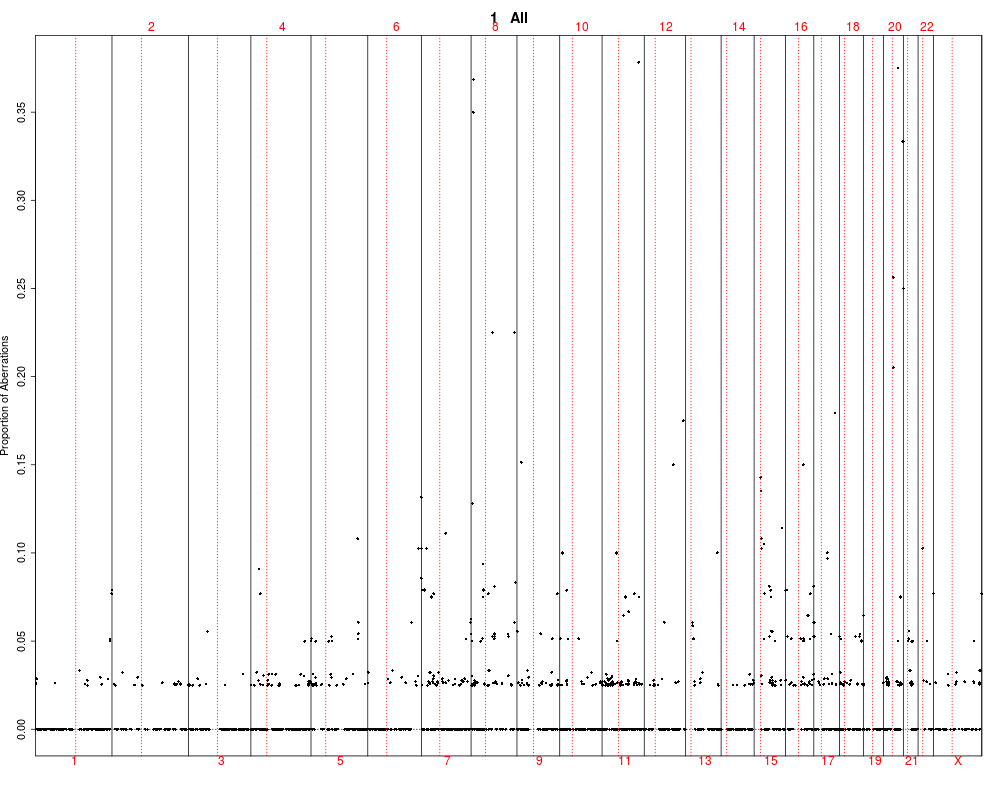
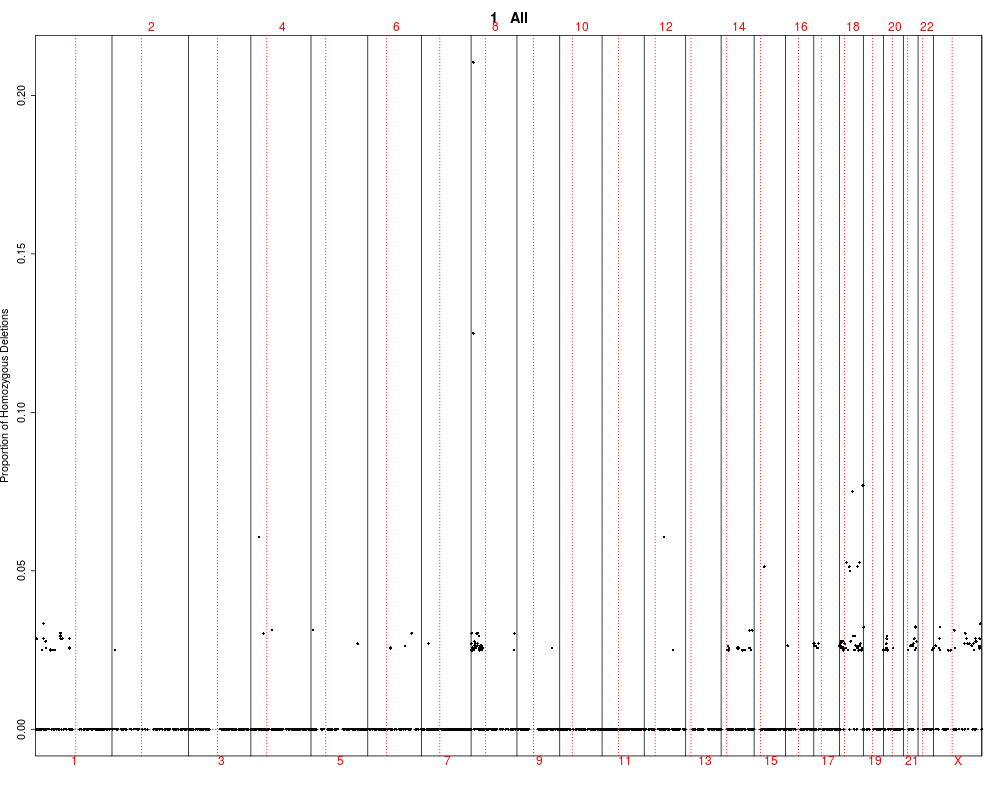
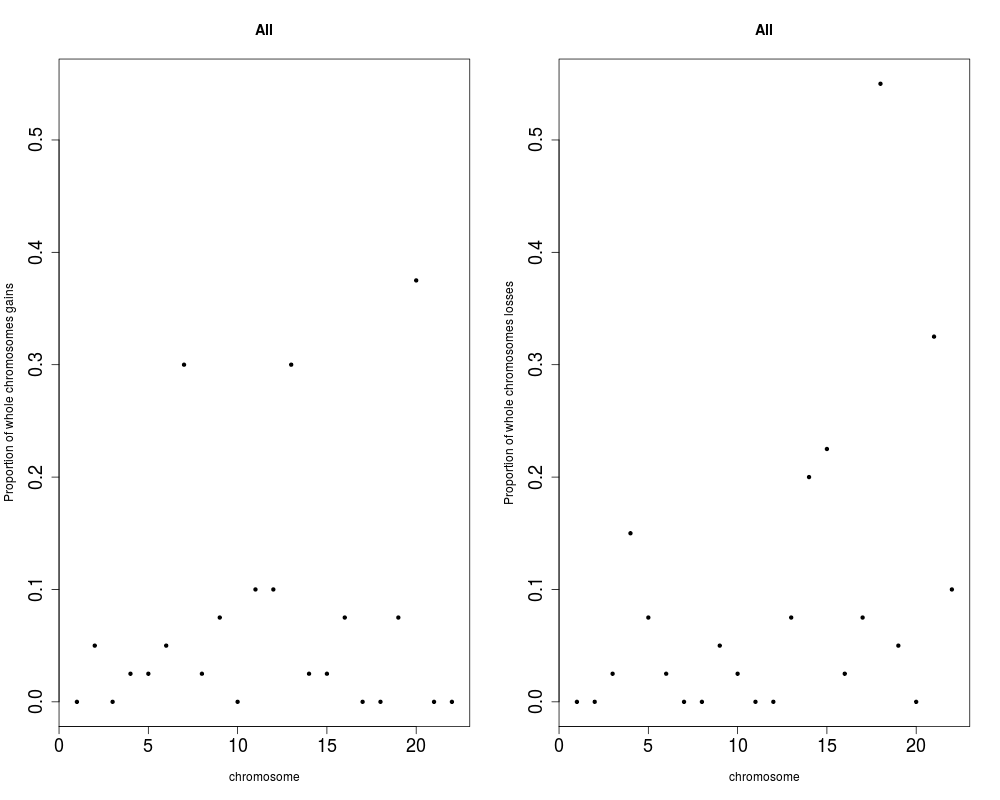
## Plotting summary of the sample profiles
plotSummaryProfile(colorectal)
Results
R version 3.3.1 (2016-06-21) -- "Bug in Your Hair"
Copyright (C) 2016 The R Foundation for Statistical Computing
Platform: x86_64-pc-linux-gnu (64-bit)

R is free software and comes with ABSOLUTELY NO WARRANTY.
You are welcome to redistribute it under certain conditions.
Type 'license()' or 'licence()' for distribution details.

R is a collaborative project with many contributors.
Type 'contributors()' for more information and
'citation()' on how to cite R or R packages in publications.

Type 'demo()' for some demos, 'help()' for on-line help, or
'help.start()' for an HTML browser interface to help.
Type 'q()' to quit R.

> library(aCGH)
Loading required package: cluster
Loading required package: survival
Loading required package: multtest
Loading required package: BiocGenerics
Loading required package: parallel

Attaching package: 'BiocGenerics'

The following objects are masked from 'package:parallel':

    clusterApply, clusterApplyLB, clusterCall, clusterEvalQ,
    clusterExport, clusterMap, parApply, parCapply, parLapply,
    parLapplyLB, parRapply, parSapply, parSapplyLB

The following objects are masked from 'package:stats':

    IQR, mad, xtabs

The following objects are masked from 'package:base':

    Filter, Find, Map, Position, Reduce, anyDuplicated, append,
    as.data.frame, cbind, colnames, do.call, duplicated, eval, evalq,
    get, grep, grepl, intersect, is.unsorted, lapply, lengths, mapply,
    match, mget, order, paste, pmax, pmax.int, pmin, pmin.int, rank,
    rbind, rownames, sapply, setdiff, sort, table, tapply, union,
    unique, unsplit

Loading required package: Biobase
Welcome to Bioconductor

    Vignettes contain introductory material; view with
    'browseVignettes()'. To cite Bioconductor, see
    'citation("Biobase")', and for packages 'citation("pkgname")'.


Attaching package: 'aCGH'

The following object is masked from 'package:stats':

    heatmap

> png(filename="/home/ddbj/snapshot/RGM3/R_BC/result/aCGH/plotSummaryProfile.Rd_%03d_medium.png", width=480, height=480)
> ### Name: plotSummaryProfile
> ### Title: plotSummaryProfile
> ### Aliases: plotSummaryProfile
> ### Keywords: hplot
>
> ### ** Examples
>
>
> data(colorectal)
>
> ## Plotting summary of the sample profiles
> plotSummaryProfile(colorectal)
Warning messages:
1: In bxp(list(stats = c(0, 0.5, 4, 5, 10), n = 40, conf = c(2.87581029181014,  :
  some notches went outside hinges ('box'): maybe set notch=FALSE
2: In bxp(list(stats = c(0, 0, 0, 0.5, 1), n = 40, conf = c(-0.124909967576651,  :
  some notches went outside hinges ('box'): maybe set notch=FALSE
3: In bxp(list(stats = c(0, 0, 0, 0.5, 1), n = 40, conf = c(-0.124909967576651,  :
  some notches went outside hinges ('box'): maybe set notch=FALSE
>
>
>
>
>
>
> dev.off()
null device
          1
>
 .
.