Supported by Dr. Osamu Ogasawara and  . . |
|
Last data update: 2014.03.03 |
Rescales channel vectors to get the same averageDescriptionRescales channel vectors to get the same average. Usage## S3 method for class 'list' normalizeDifferencesToAverage(x, baseline=1, FUN=median, ...) Arguments
ValueReturns a normalized Author(s)Henrik Bengtsson Examples
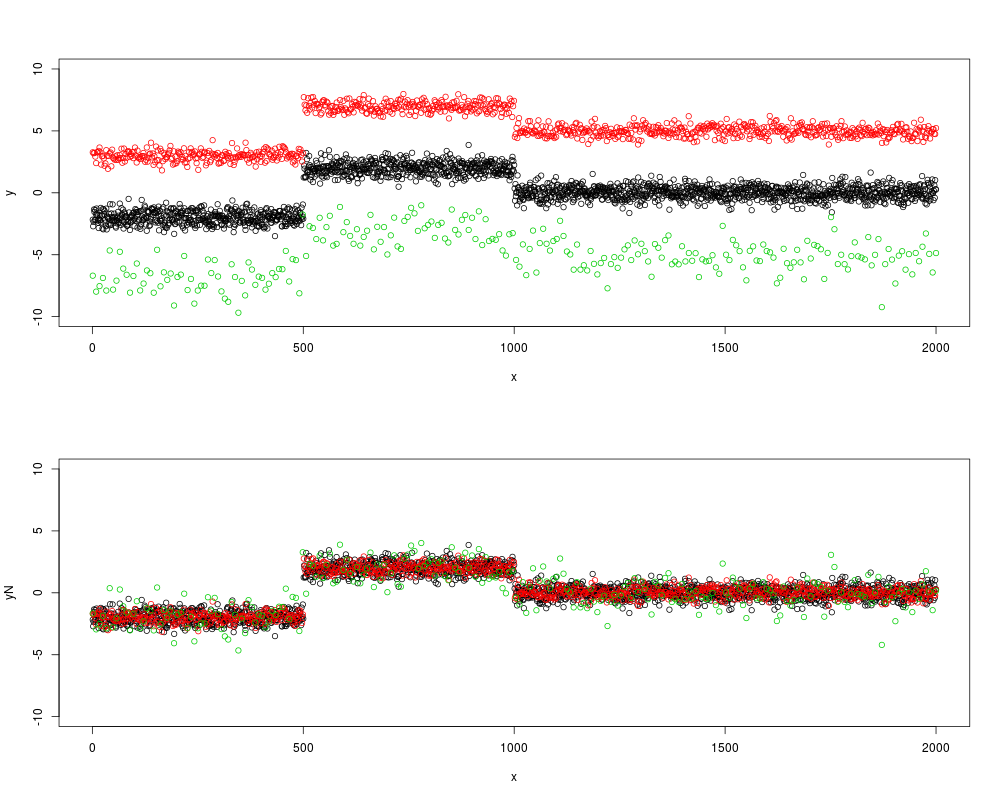
# Simulate three shifted tracks of different lengths with same profiles
ns <- c(A=2, B=1, C=0.25)*1000;
xx <- lapply(ns, FUN=function(n) { seq(from=1, to=max(ns), length.out=n) });
zz <- mapply(seq(along=ns), ns, FUN=function(z,n) rep(z,n));

yy <- list(
  A = rnorm(ns["A"], mean=0, sd=0.5),
  B = rnorm(ns["B"], mean=5, sd=0.4),
  C = rnorm(ns["C"], mean=-5, sd=1.1)
);
yy <- lapply(yy, FUN=function(y) {
  n <- length(y);
  y[1:(n/2)] <- y[1:(n/2)] + 2;
  y[1:(n/4)] <- y[1:(n/4)] - 4;
  y;
});

# Shift all tracks toward the first track
yyN <- normalizeDifferencesToAverage(yy, baseline=1);

# The baseline channel is not changed
stopifnot(identical(yy[[1]], yyN[[1]]));

# Get the estimated parameters
fit <- attr(yyN, "fit");

# Plot the tracks
layout(matrix(1:2, ncol=1));
x <- unlist(xx);
col <- unlist(zz);
y <- unlist(yy);
yN <- unlist(yyN);
plot(x, y, col=col, ylim=c(-10,10));
plot(x, yN, col=col, ylim=c(-10,10));
Results
R version 3.3.1 (2016-06-21) -- "Bug in Your Hair"
Copyright (C) 2016 The R Foundation for Statistical Computing
Platform: x86_64-pc-linux-gnu (64-bit)

R is free software and comes with ABSOLUTELY NO WARRANTY.
You are welcome to redistribute it under certain conditions.
Type 'license()' or 'licence()' for distribution details.

R is a collaborative project with many contributors.
Type 'contributors()' for more information and
'citation()' on how to cite R or R packages in publications.

Type 'demo()' for some demos, 'help()' for on-line help, or
'help.start()' for an HTML browser interface to help.
Type 'q()' to quit R.

> library(aroma.light)
aroma.light v3.2.0 (2016-01-06) successfully loaded. See ?aroma.light for help.
> png(filename="/home/ddbj/snapshot/RGM3/R_BC/result/aroma.light/normalizeDifferencesToAverage.Rd_%03d_medium.png", width=480, height=480)
> ### Name: normalizeDifferencesToAverage
> ### Title: Rescales channel vectors to get the same average
> ### Aliases: normalizeDifferencesToAverage
> ###   normalizeDifferencesToAverage.list
> ### Keywords: methods
>
> ### ** Examples
>
> # Simulate three shifted tracks of different lengths with same profiles
> ns <- c(A=2, B=1, C=0.25)*1000;
> xx <- lapply(ns, FUN=function(n) { seq(from=1, to=max(ns), length.out=n) });
> zz <- mapply(seq(along=ns), ns, FUN=function(z,n) rep(z,n));
>
> yy <- list(
+   A = rnorm(ns["A"], mean=0, sd=0.5),
+   B = rnorm(ns["B"], mean=5, sd=0.4),
+   C = rnorm(ns["C"], mean=-5, sd=1.1)
+ );
> yy <- lapply(yy, FUN=function(y) {
+   n <- length(y);
+   y[1:(n/2)] <- y[1:(n/2)] + 2;
+   y[1:(n/4)] <- y[1:(n/4)] - 4;
+   y;
+ });
>
> # Shift all tracks toward the first track
> yyN <- normalizeDifferencesToAverage(yy, baseline=1);
>
> # The baseline channel is not changed
> stopifnot(identical(yy[[1]], yyN[[1]]));
>
> # Get the estimated parameters
> fit <- attr(yyN, "fit");
>
> # Plot the tracks
> layout(matrix(1:2, ncol=1));
> x <- unlist(xx);
> col <- unlist(zz);
> y <- unlist(yy);
> yN <- unlist(yyN);
> plot(x, y, col=col, ylim=c(-10,10));
> plot(x, yN, col=col, ylim=c(-10,10));
>
>
>
>
>
> dev.off()
null device
          1
>
|
Created & Maintained by Osamu Ogasawara (osamu.ogasawara@gmail.com) and 