Supported by Dr. Osamu Ogasawara and  . . |
|
Last data update: 2014.03.03 |
Normalizes the empirical distribution of one or more samples to a target distributionDescriptionNormalizes the empirical distribution of one or more samples to a target distribution. After normalization, all samples have the same average empirical density distribution. Usage## S3 method for class 'numeric' normalizeQuantileSpline(x, w=NULL, xTarget, sortTarget=TRUE, robust=TRUE, ...) ## S3 method for class 'matrix' normalizeQuantileSpline(X, w=NULL, xTarget=NULL, sortTarget=TRUE, robust=TRUE, ...) ## S3 method for class 'list' normalizeQuantileSpline(X, w=NULL, xTarget=NULL, sortTarget=TRUE, robust=TRUE, ...) Arguments
ValueReturns an object of the same type and dimensions as the input. Missing valuesBoth argument Author(s)Henrik Bengtsson References[1] H. Bengtsson, R. Irizarry, B. Carvalho, and T. Speed, Estimation and assessment of raw copy numbers at the single locus level, Bioinformatics, 2008.
See AlsoThe target distribution can be calculated as the average
using Internally either
An alternative normalization method that is also normalizing the
empirical densities of samples is Examples
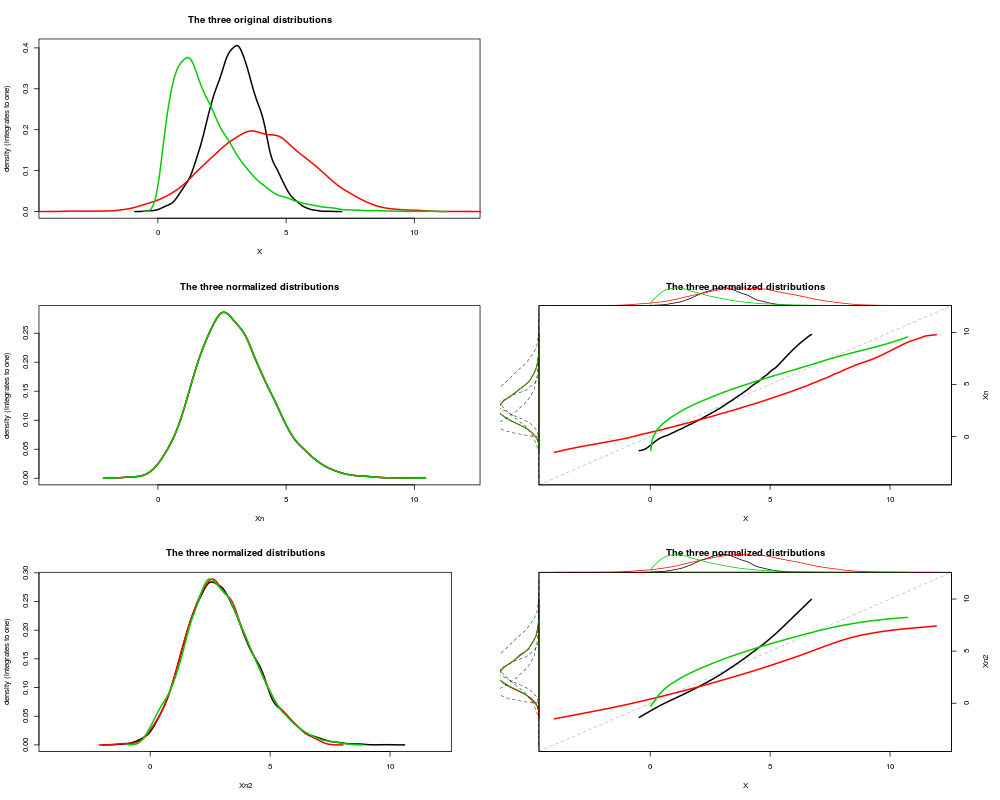
# Simulate three samples with on average 20% missing values
N <- 10000
X <- cbind(rnorm(N, mean=3, sd=1),
           rnorm(N, mean=4, sd=2),
           rgamma(N, shape=2, rate=1))
X[sample(3*N, size=0.20*3*N)] <- NA

# Plot the data
layout(matrix(c(1,0,2:5), ncol=2, byrow=TRUE))
xlim <- range(X, na.rm=TRUE);
plotDensity(X, lwd=2, xlim=xlim, main="The three original distributions")

Xn <- normalizeQuantile(X)
plotDensity(Xn, lwd=2, xlim=xlim, main="The three normalized distributions")
plotXYCurve(X, Xn, xlim=xlim, main="The three normalized distributions")

Xn2 <- normalizeQuantileSpline(X, xTarget=Xn[,1], spar=0.99)
plotDensity(Xn2, lwd=2, xlim=xlim, main="The three normalized distributions")
plotXYCurve(X, Xn2, xlim=xlim, main="The three normalized distributions")
Results
R version 3.3.1 (2016-06-21) -- "Bug in Your Hair"
Copyright (C) 2016 The R Foundation for Statistical Computing
Platform: x86_64-pc-linux-gnu (64-bit)

R is free software and comes with ABSOLUTELY NO WARRANTY.
You are welcome to redistribute it under certain conditions.
Type 'license()' or 'licence()' for distribution details.

R is a collaborative project with many contributors.
Type 'contributors()' for more information and
'citation()' on how to cite R or R packages in publications.

Type 'demo()' for some demos, 'help()' for on-line help, or
'help.start()' for an HTML browser interface to help.
Type 'q()' to quit R.

> library(aroma.light)
aroma.light v3.2.0 (2016-01-06) successfully loaded. See ?aroma.light for help.
> png(filename="/home/ddbj/snapshot/RGM3/R_BC/result/aroma.light/normalizeQuantileSpline.Rd_%03d_medium.png", width=480, height=480)
> ### Name: normalizeQuantileSpline
> ### Title: Normalizes the empirical distribution of one or more samples to
> ###   a target distribution
> ### Aliases: normalizeQuantileSpline normalizeQuantileSpline.numeric
> ###   normalizeQuantileSpline.matrix normalizeQuantileSpline.list
> ### Keywords: methods nonparametric multivariate robust
>
> ### ** Examples
>
> # Simulate three samples with on average 20% missing values
> N <- 10000
> X <- cbind(rnorm(N, mean=3, sd=1),
+            rnorm(N, mean=4, sd=2),
+            rgamma(N, shape=2, rate=1))
> X[sample(3*N, size=0.20*3*N)] <- NA
>
> # Plot the data
> layout(matrix(c(1,0,2:5), ncol=2, byrow=TRUE))
> xlim <- range(X, na.rm=TRUE);
> plotDensity(X, lwd=2, xlim=xlim, main="The three original distributions")
>
> Xn <- normalizeQuantile(X)
> plotDensity(Xn, lwd=2, xlim=xlim, main="The three normalized distributions")
> plotXYCurve(X, Xn, xlim=xlim, main="The three normalized distributions")
>
> Xn2 <- normalizeQuantileSpline(X, xTarget=Xn[,1], spar=0.99)
> plotDensity(Xn2, lwd=2, xlim=xlim, main="The three normalized distributions")
> plotXYCurve(X, Xn2, xlim=xlim, main="The three normalized distributions")
>
>
>
>
>
> dev.off()
null device
          1
>
|