Supported by Dr. Osamu Ogasawara and  . . |
|
Last data update: 2014.03.03 |
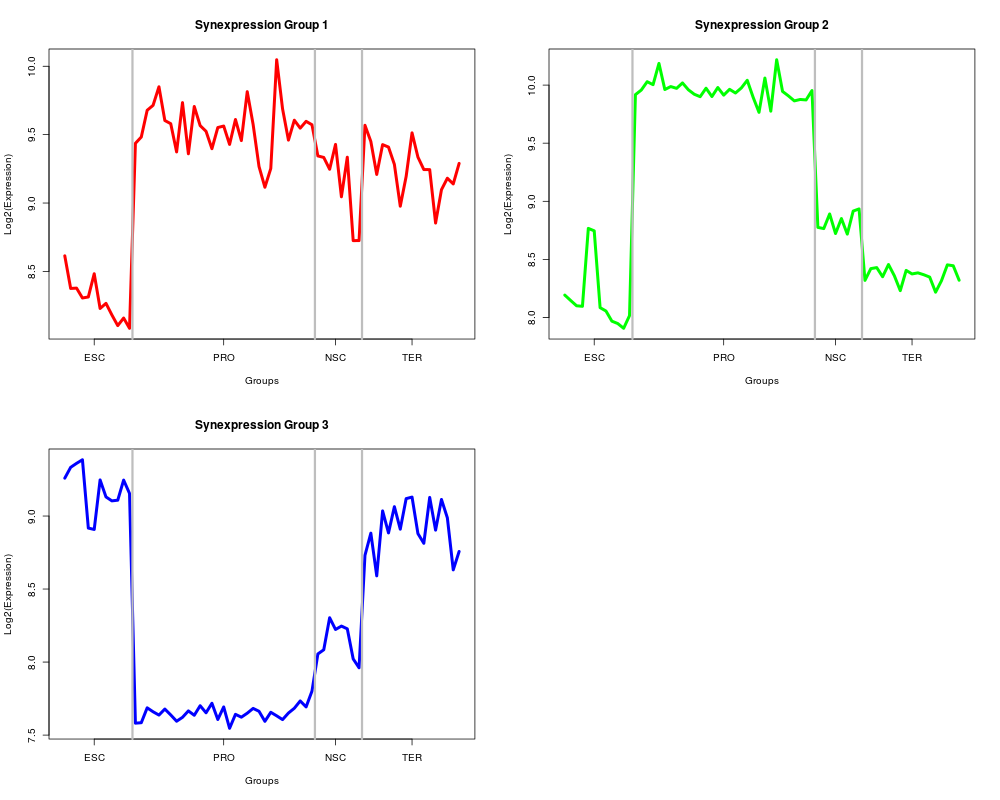
Visualizing the Average Expression Profile of a Synexpression Group.DescriptionThis function plots the average expression profile for a specific synexpression group. Usageplotsynexprs(mySynExpressionSet, tickMarks, tickLabels, vertLines, index=1, ...) Arguments
DetailsGeneric plotting parameters can be passed to this function to create a more sophisticated plot, e.g ValueA plot showing the average expression profile for the synexpression group specified. Author(s)Jessica Mar Examples
data(subset.loring.eset)
attractor.states <- findAttractors(subset.loring.eset, "celltype", nperm=10, annotation="illuminaHumanv1.db")
remove.these.genes <- removeFlatGenes(subset.loring.eset, "celltype", contrasts=NULL, limma.cutoff=0.05)
mapk.syn <- findSynexprs("04010", attractor.states, remove.these.genes)
par(mfrow=c(2,2))
pretty.col <- rainbow(3)
for( i in 1:3 ){
	plotsynexprs(mapk.syn, tickMarks=c(6, 28, 47, 60), tickLabels=c("ESC", "PRO", "NSC", "TER"), vertLines=c(12.5, 43.5, 51.5), index=i,
			main=paste("Synexpression Group ", i, sep=""), col=pretty.col[i])
 }
Results
R version 3.3.1 (2016-06-21) -- "Bug in Your Hair"
Copyright (C) 2016 The R Foundation for Statistical Computing
Platform: x86_64-pc-linux-gnu (64-bit)

R is free software and comes with ABSOLUTELY NO WARRANTY.
You are welcome to redistribute it under certain conditions.
Type 'license()' or 'licence()' for distribution details.

R is a collaborative project with many contributors.
Type 'contributors()' for more information and
'citation()' on how to cite R or R packages in publications.

Type 'demo()' for some demos, 'help()' for on-line help, or
'help.start()' for an HTML browser interface to help.
Type 'q()' to quit R.

> library(attract)
Loading required package: AnnotationDbi
Loading required package: stats4
Loading required package: BiocGenerics
Loading required package: parallel

Attaching package: 'BiocGenerics'

The following objects are masked from 'package:parallel':

    clusterApply, clusterApplyLB, clusterCall, clusterEvalQ,
    clusterExport, clusterMap, parApply, parCapply, parLapply,
    parLapplyLB, parRapply, parSapply, parSapplyLB

The following objects are masked from 'package:stats':

    IQR, mad, xtabs

The following objects are masked from 'package:base':

    Filter, Find, Map, Position, Reduce, anyDuplicated, append,
    as.data.frame, cbind, colnames, do.call, duplicated, eval, evalq,
    get, grep, grepl, intersect, is.unsorted, lapply, lengths, mapply,
    match, mget, order, paste, pmax, pmax.int, pmin, pmin.int, rank,
    rbind, rownames, sapply, setdiff, sort, table, tapply, union,
    unique, unsplit

Loading required package: Biobase
Welcome to Bioconductor

    Vignettes contain introductory material; view with
    'browseVignettes()'. To cite Bioconductor, see
    'citation("Biobase")', and for packages 'citation("pkgname")'.

Loading required package: IRanges
Loading required package: S4Vectors

Attaching package: 'S4Vectors'

The following objects are masked from 'package:base':

    colMeans, colSums, expand.grid, rowMeans, rowSums


> png(filename="/home/ddbj/snapshot/RGM3/R_BC/result/attract/plotsynexprs.Rd_%03d_medium.png", width=480, height=480)
> ### Name: plotsynexprs
> ### Title: Visualizing the Average Expression Profile of a Synexpression
> ###   Group.
> ### Aliases: plotsynexprs
> ### Keywords: aplot
>
> ### ** Examples
>
> data(subset.loring.eset)
> attractor.states <- findAttractors(subset.loring.eset, "celltype", nperm=10, annotation="illuminaHumanv1.db")
Loading required package: illuminaHumanv1.db
Loading required package: org.Hs.eg.db

> remove.these.genes <- removeFlatGenes(subset.loring.eset, "celltype", contrasts=NULL, limma.cutoff=0.05)
> mapk.syn <- findSynexprs("04010", attractor.states, remove.these.genes)
[1] "04010"
> par(mfrow=c(2,2))
> pretty.col <- rainbow(3)
> for( i in 1:3 ){
+ 	plotsynexprs(mapk.syn, tickMarks=c(6, 28, 47, 60), tickLabels=c("ESC", "PRO", "NSC", "TER"), vertLines=c(12.5, 43.5, 51.5), index=i,
+ 			main=paste("Synexpression Group ", i, sep=""), col=pretty.col[i])
+  }
>
>
>
>
>
> dev.off()
null device
          1
>
|