Supported by Dr. Osamu Ogasawara and  . . |
|
Last data update: 2014.03.03 |
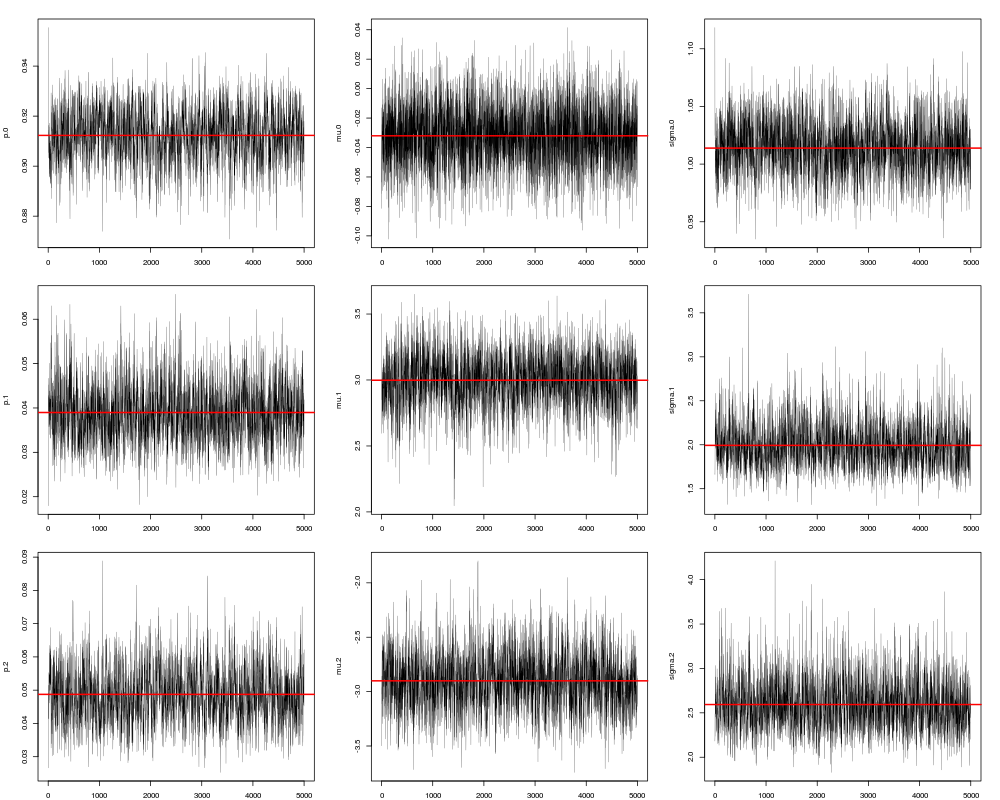
Method to plot Gibbs sampling tracesDescriptionMethod to plot Gibbs sampling traces Usagetraces(object, burnin = TRUE, index = 1) ## S4 method for signature 'Bacon' traces(object, burnin = TRUE, index = 1) Arguments
Valueplot of the Gibbs Sampler traces See Also
Examplesy <- rnormmix(2000, c(0.9, 0, 1, 0, 4, 1)) ##nbins = 100 to speed up the calculations bc <- bacon(y, nbins=100) traces(bc) Results
R version 3.3.1 (2016-06-21) -- "Bug in Your Hair"
Copyright (C) 2016 The R Foundation for Statistical Computing
Platform: x86_64-pc-linux-gnu (64-bit)

R is free software and comes with ABSOLUTELY NO WARRANTY.
You are welcome to redistribute it under certain conditions.
Type 'license()' or 'licence()' for distribution details.

R is a collaborative project with many contributors.
Type 'contributors()' for more information and
'citation()' on how to cite R or R packages in publications.

Type 'demo()' for some demos, 'help()' for on-line help, or
'help.start()' for an HTML browser interface to help.
Type 'q()' to quit R.

> library(bacon)
Loading required package: ggplot2
Loading required package: BiocParallel
Loading required package: ellipse
> png(filename="/home/ddbj/snapshot/RGM3/R_BC/result/bacon/traces-methods.Rd_%03d_medium.png", width=480, height=480)
> ### Name: traces
> ### Title: Method to plot Gibbs sampling traces
> ### Aliases: traces traces,Bacon-method
>
> ### ** Examples
>
> y <- rnormmix(2000, c(0.9, 0, 1, 0, 4, 1))
> ##nbins = 100 to speed up the calculations
> bc <- bacon(y, nbins=100)
> traces(bc)
>
>
>
>
>
> dev.off()
null device
          1
>
|
Created & Maintained by Osamu Ogasawara (osamu.ogasawara@gmail.com) and 