Supported by Dr. Osamu Ogasawara and  . . |
|
Last data update: 2014.03.03 |
|
x |
ExpressionSet containing expression levels, or list of ExpressionSets |
groups |
Variable in fData(x) indicating the two groups to compare (the case with more than 2 groups is not implemented). |
logfc |
Biologically relevant threshold for the log fold change, i.e. difference between groups means in log-scale |
minCount |
If specified, probabilities are only computed for rows with |
method |
Set to |
mc.cores |
Number of parallel processors to use. Ignored unless
|
p.adjust.method |
P-value adjustment method, passed on to |
Value
If x is a single ExpressionSet, probNonEquiv
returns a vector with posterior probabilities
(NA for rows with less than minCount reads).
pvalTreat returns TREAT P-values instead.
If x is a list of ExpressionSet, the function is applied
to each element separately and results are returned as columns in the
output matrix.
Author(s)
Victor Pena, David Rossell
References
Rossell D, Stephan-Otto Attolini C, Kroiss M, Stocker A. Quantifying Alternative Splicing from Paired-End RNA-sequencing data. Annals of Applied Statistics, 8(1):309-330
McCarthy DJ, Smyth GK. Testing significance relative to a fold-change threshold is a TREAT. Bioinformatics, 25(6):765-771
See Also
treat in package limma, p.adjust
Examples
#Simulate toy data
p <- 50; n <- 10
x <- matrix(rnorm(p*2*n),nrow=p)
x[(p-10):p,1:n] <- x[(p-10):p,1:n] + 1.5
x <- new("ExpressionSet",exprs=x)
x$group <- rep(c('group1','group2'),each=n)
#Posterior probabilities
pp <- probNonEquiv(x, groups='group', logfc=0.5)
d <- rowMeans(exprs(x[,1:n])) - rowMeans(exprs(x[,-1:-n]))
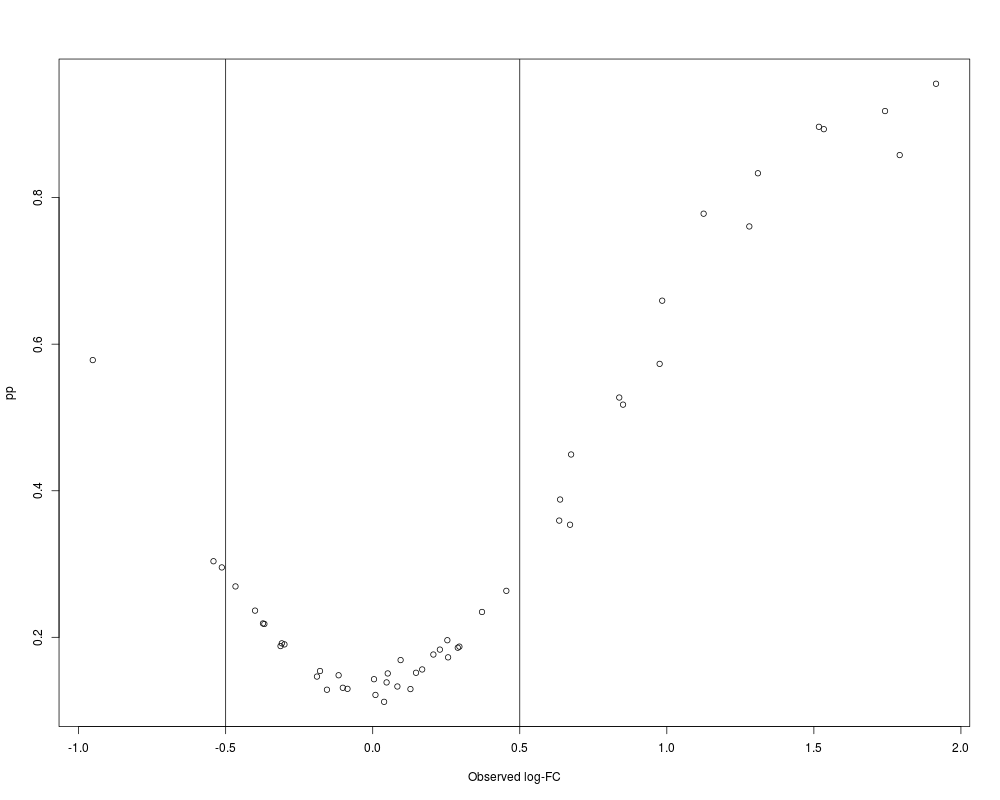
plot(d,pp,xlab='Observed log-FC')
abline(v=c(-.5,.5))
#Check false positives
truth <- rep(c(FALSE,TRUE),c(p-11,11))
getRoc(truth, pp>.9)
getRoc(truth, pp>.5)
Results
R version 3.3.1 (2016-06-21) -- "Bug in Your Hair"
Copyright (C) 2016 The R Foundation for Statistical Computing
Platform: x86_64-pc-linux-gnu (64-bit)

R is free software and comes with ABSOLUTELY NO WARRANTY.
You are welcome to redistribute it under certain conditions.
Type 'license()' or 'licence()' for distribution details.

R is a collaborative project with many contributors.
Type 'contributors()' for more information and
'citation()' on how to cite R or R packages in publications.

Type 'demo()' for some demos, 'help()' for on-line help, or
'help.start()' for an HTML browser interface to help.
Type 'q()' to quit R.

> library(casper)
Loading required package: Biobase
Loading required package: BiocGenerics
Loading required package: parallel

Attaching package: 'BiocGenerics'

The following objects are masked from 'package:parallel':

    clusterApply, clusterApplyLB, clusterCall, clusterEvalQ,
    clusterExport, clusterMap, parApply, parCapply, parLapply,
    parLapplyLB, parRapply, parSapply, parSapplyLB

The following objects are masked from 'package:stats':

    IQR, mad, xtabs

The following objects are masked from 'package:base':

    Filter, Find, Map, Position, Reduce, anyDuplicated, append,
    as.data.frame, cbind, colnames, do.call, duplicated, eval, evalq,
    get, grep, grepl, intersect, is.unsorted, lapply, lengths, mapply,
    match, mget, order, paste, pmax, pmax.int, pmin, pmin.int, rank,
    rbind, rownames, sapply, setdiff, sort, table, tapply, union,
    unique, unsplit

Welcome to Bioconductor

    Vignettes contain introductory material; view with
    'browseVignettes()'. To cite Bioconductor, see
    'citation("Biobase")', and for packages 'citation("pkgname")'.

Loading required package: IRanges
Loading required package: S4Vectors
Loading required package: stats4

Attaching package: 'S4Vectors'

The following objects are masked from 'package:base':

    colMeans, colSums, expand.grid, rowMeans, rowSums

Loading required package: GenomicRanges
Loading required package: GenomeInfoDb
> png(filename="/home/ddbj/snapshot/RGM3/R_BC/result/casper/probNonEquiv.Rd_%03d_medium.png", width=480, height=480)
> ### Name: probNonEquiv
> ### Title: 'probNonEquiv' performs a Bayesian hypothesis test for
> ###   equivalence between group means.  It returns the posterior
> ###   probability that |mu1-mu2|>logfc. 'pvalTreat' is a wrapper to 'treat'
> ###   in package 'limma', which returns P-values for the same hypothesis
> ###   test.
> ### Aliases: probNonEquiv probNonEquiv,ExpressionSet-method
> ###   probNonEquiv,list-method pvalTreat pvalTreat,ExpressionSet-method
> ###   pvalTreat,list-method
> ### Keywords: models htest
>
> ### ** Examples
>
>   #Simulate toy data
>   p <- 50; n <- 10
>   x <- matrix(rnorm(p*2*n),nrow=p)
>   x[(p-10):p,1:n] <- x[(p-10):p,1:n] + 1.5
>   x <- new("ExpressionSet",exprs=x)
>   x$group <- rep(c('group1','group2'),each=n)
>
>   #Posterior probabilities
>   pp <- probNonEquiv(x, groups='group', logfc=0.5)
>   d <- rowMeans(exprs(x[,1:n])) - rowMeans(exprs(x[,-1:-n]))
>   plot(d,pp,xlab='Observed log-FC')
>   abline(v=c(-.5,.5))
>
>   #Check false positives
>   truth <- rep(c(FALSE,TRUE),c(p-11,11))
>   getRoc(truth, pp>.9)
  tp fp tn fn p fdr       pow
1  6  0 39  5 6   0 0.5454545
>   getRoc(truth, pp>.5)
  tp fp tn fn  p  fdr       pow
1  9  3 36  2 12 0.25 0.8181818
>
>
>
>
>
> dev.off()
null device
          1
>
|