Supported by Dr. Osamu Ogasawara and  . . |
|
Last data update: 2014.03.03 |
Fit growth curvesDescriptionFit a cell growth curve Usage
  fitCellGrowth(x, z, model = "locfit",
    locfit.h = 3 * 60 * 60, locfit.deg = 2,
    relative.height.at.lag = 0.1)
Arguments
DetailsFor the non-parametric "locfit" model, local regression
is done by a call to ValueFit as returned by Author(s)Julien Gagneur and Moritz Matthey See Also
Examples
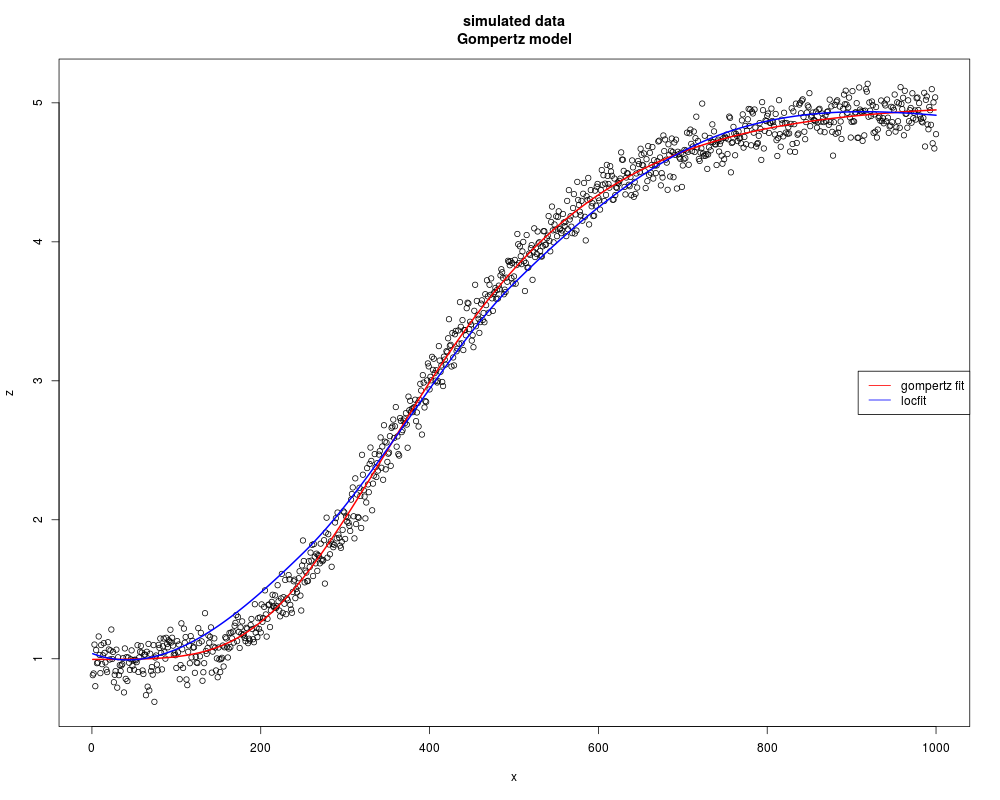
x = 1:1000
          z = gompertz(x, mu=0.01, l=200, z0=1, zmax=5) + rnorm(length(x),sd=0.1)
          f = fitCellGrowth(x, z, model = "gompertz")
          floc = fitCellGrowth(x, z, model = "locfit", locfit.h=500)
          	plot(x,z, main="simulated data\nGompertz model")
          	lines(x, predict(f,x), lwd=2, col="red")
          	lines(x, predict(floc,x), lwd=2, col="blue")
          	legend( "right", legend=c("gompertz fit", "locfit"), lwd=1, col=c("red","blue") )
Results
R version 3.3.1 (2016-06-21) -- "Bug in Your Hair"
Copyright (C) 2016 The R Foundation for Statistical Computing
Platform: x86_64-pc-linux-gnu (64-bit)

R is free software and comes with ABSOLUTELY NO WARRANTY.
You are welcome to redistribute it under certain conditions.
Type 'license()' or 'licence()' for distribution details.

R is a collaborative project with many contributors.
Type 'contributors()' for more information and
'citation()' on how to cite R or R packages in publications.

Type 'demo()' for some demos, 'help()' for on-line help, or
'help.start()' for an HTML browser interface to help.
Type 'q()' to quit R.

> library(cellGrowth)
Loading required package: locfit
locfit 1.5-9.1 	 2013-03-22
> png(filename="/home/ddbj/snapshot/RGM3/R_BC/result/cellGrowth/fitCellGrowth.Rd_%03d_medium.png", width=480, height=480)
> ### Name: fitCellGrowth
> ### Title: Fit growth curves
> ### Aliases: fitCellGrowth
>
> ### ** Examples
>
> x = 1:1000
>           z = gompertz(x, mu=0.01, l=200, z0=1, zmax=5) + rnorm(length(x),sd=0.1)
>           f = fitCellGrowth(x, z, model = "gompertz")
>           floc = fitCellGrowth(x, z, model = "locfit", locfit.h=500)
>           	plot(x,z, main="simulated data\nGompertz model")
>           	lines(x, predict(f,x), lwd=2, col="red")
>           	lines(x, predict(floc,x), lwd=2, col="blue")
>           	legend( "right", legend=c("gompertz fit", "locfit"), lwd=1, col=c("red","blue") )
>
>
>
>
>
> dev.off()
null device
          1
>
|