Supported by Dr. Osamu Ogasawara and  . . |
|
Last data update: 2014.03.03 |
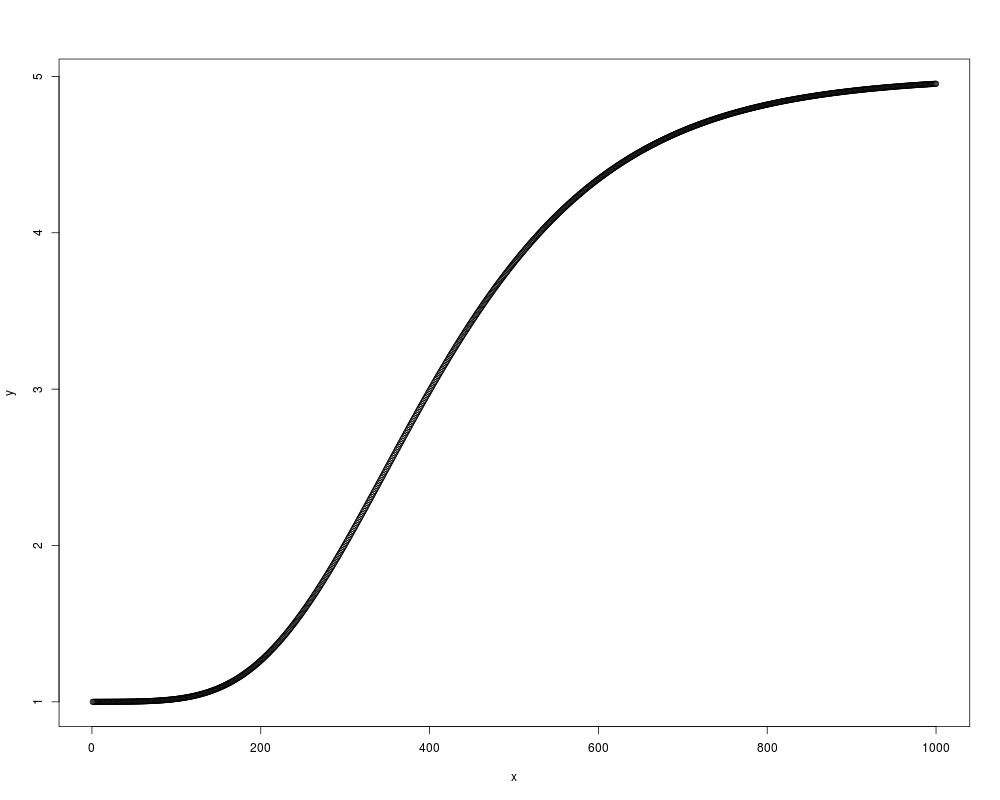
Gompertz growth modelDescriptionGompertz growth model as defined in Zwietering et al. Usagegompertz(x, mu, l, z0, zmax) Arguments
Value
Author(s)Julien Gagneur ReferencesZwietering, et al. Modeling of the Bacterial Growth Curve, APPLIED AND ENVIRONMENTAL MICROBIOLOGY, 1990. Examplesx = 1:1000 y = gompertz(x, mu=0.01, l=200, z0=1, zmax=5) plot(x,y) Results
R version 3.3.1 (2016-06-21) -- "Bug in Your Hair"
Copyright (C) 2016 The R Foundation for Statistical Computing
Platform: x86_64-pc-linux-gnu (64-bit)

R is free software and comes with ABSOLUTELY NO WARRANTY.
You are welcome to redistribute it under certain conditions.
Type 'license()' or 'licence()' for distribution details.

R is a collaborative project with many contributors.
Type 'contributors()' for more information and
'citation()' on how to cite R or R packages in publications.

Type 'demo()' for some demos, 'help()' for on-line help, or
'help.start()' for an HTML browser interface to help.
Type 'q()' to quit R.

> library(cellGrowth)
Loading required package: locfit
locfit 1.5-9.1 	 2013-03-22
> png(filename="/home/ddbj/snapshot/RGM3/R_BC/result/cellGrowth/gompertz.Rd_%03d_medium.png", width=480, height=480)
> ### Name: gompertz
> ### Title: Gompertz growth model
> ### Aliases: gompertz
>
> ### ** Examples
>
> x = 1:1000
> y = gompertz(x, mu=0.01, l=200, z0=1, zmax=5)
> plot(x,y)
>
>
>
>
>
> dev.off()
null device
          1
>
|
Created & Maintained by Osamu Ogasawara (osamu.ogasawara@gmail.com) and 