Supported by Dr. Osamu Ogasawara and  . . |
|
Last data update: 2014.03.03 |
Guess growth models parametersDescriptionGuess initial parameters values for growth models UsageguessCellGrowthParams(x, z, relative.height.at.lag = 0.1) Arguments
DetailsThe relative.height.at.lag parameter should be close to the relative height of the point, where the curve reaches its maximal slope. If the fitting fails, try to set this parameter to a different value. ValueA list with entries:
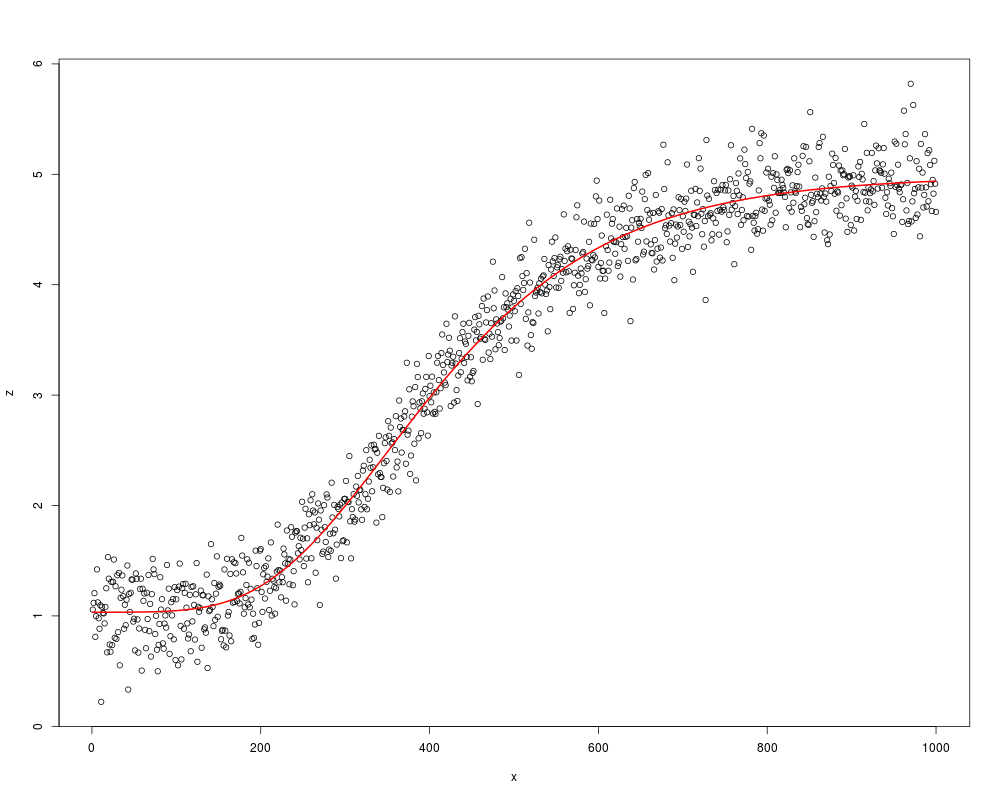
Author(s)Julien Gagneur Examplesx <- 1:1000 z <- gompertz(x, mu=0.01, l=200, z0=1, zmax=5)+rnorm(length(x),mean=0,sd=0.25) guess <- guessCellGrowthParams(x,z,relative.height.at.lag=0.5) fit <- nls(z~gompertz(x,mu,l,z0,zmax),start=guess) plot(x,z) lines(x,predict(fit,x),lwd=2,col="red") Results
R version 3.3.1 (2016-06-21) -- "Bug in Your Hair"
Copyright (C) 2016 The R Foundation for Statistical Computing
Platform: x86_64-pc-linux-gnu (64-bit)

R is free software and comes with ABSOLUTELY NO WARRANTY.
You are welcome to redistribute it under certain conditions.
Type 'license()' or 'licence()' for distribution details.

R is a collaborative project with many contributors.
Type 'contributors()' for more information and
'citation()' on how to cite R or R packages in publications.

Type 'demo()' for some demos, 'help()' for on-line help, or
'help.start()' for an HTML browser interface to help.
Type 'q()' to quit R.

> library(cellGrowth)
Loading required package: locfit
locfit 1.5-9.1 	 2013-03-22
> png(filename="/home/ddbj/snapshot/RGM3/R_BC/result/cellGrowth/guessCellGrowthParams.Rd_%03d_medium.png", width=480, height=480)
> ### Name: guessCellGrowthParams
> ### Title: Guess growth models parameters
> ### Aliases: guessCellGrowthParams
>
> ### ** Examples
>
> x <- 1:1000
> z <- gompertz(x, mu=0.01, l=200, z0=1, zmax=5)+rnorm(length(x),mean=0,sd=0.25)
> guess <- guessCellGrowthParams(x,z,relative.height.at.lag=0.5)
> fit <- nls(z~gompertz(x,mu,l,z0,zmax),start=guess)
> 	plot(x,z)
> lines(x,predict(fit,x),lwd=2,col="red")
>
>
>
>
>
> dev.off()
null device
          1
>
|
Created & Maintained by Osamu Ogasawara (osamu.ogasawara@gmail.com) and 