optional plot parameters passed to the plot
function
Author(s)
Andreas Neudecker
Examples
# Parse file
dat = readYeastGrower( system.file("extdata", "Plate1_YPFruc.txt", package="cellGrowth") )
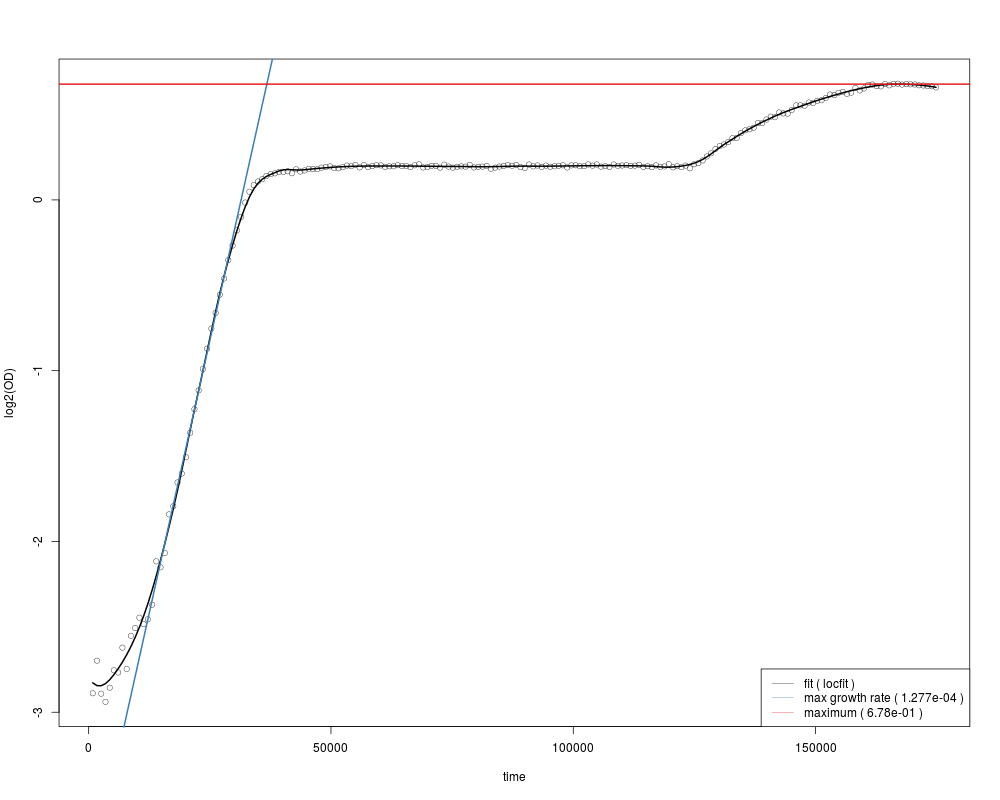
# fit
n <- names( dat$OD)[36]
fit <- fitCellGrowth(x=dat$time,z=log2(dat$OD[[n]]), model = "locfit")
plot(fit)
Results
R version 3.3.1 (2016-06-21) -- "Bug in Your Hair"
Copyright (C) 2016 The R Foundation for Statistical Computing
Platform: x86_64-pc-linux-gnu (64-bit)

R is free software and comes with ABSOLUTELY NO WARRANTY.
You are welcome to redistribute it under certain conditions.
Type 'license()' or 'licence()' for distribution details.

R is a collaborative project with many contributors.
Type 'contributors()' for more information and
'citation()' on how to cite R or R packages in publications.

Type 'demo()' for some demos, 'help()' for on-line help, or
'help.start()' for an HTML browser interface to help.
Type 'q()' to quit R.

> library(cellGrowth)
Loading required package: locfit
locfit 1.5-9.1 	 2013-03-22
> png(filename="/home/ddbj/snapshot/RGM3/R_BC/result/cellGrowth/plot.cellGrowthFit.Rd_%03d_medium.png", width=480, height=480)
> ### Name: plot.cellGrowthFit
> ### Title: Generic plot function for datatype cellGrowthFit
> ### Aliases: plot.cellGrowthFit
>
> ### ** Examples
>
> # Parse file
> dat = readYeastGrower( system.file("extdata", "Plate1_YPFruc.txt", package="cellGrowth") )
>
> # fit
> n <- names( dat$OD)[36]
> fit <- fitCellGrowth(x=dat$time,z=log2(dat$OD[[n]]), model = "locfit")
> plot(fit)
>
>
>
>
>
> dev.off()
null device
          1
>
 .
.