vector of characters indicating the
label of the wells
fileParser
the file parser which reads the file
generated by the machine
getWellIds
function or vector. If getWellIds is a
function its parameter is the parsed data of the file
parsed by fileParser. It should return a vector
containing the well identifiers, e.g. A01, A02, .. You
can as well set the well identifiers as a vector
directly
calibration
calibration function applied to the
raw data (before scaleY is applied)
extractRowColumn
function which converts well
identifiers into row and column names
cex
plot parameter
scaleX
factor which scales the x-axis
scaleY
function how to convert the y-axis ( e.g.
log2 )
strip.lines
height in lines of the labels
strip.cex
text-size of the labels
xlab
plot parameter
ylab
plot parameter
main
plot parameter
scales
plot parameter
...
optional plot parameter. See details
Details
All plot parameters are passed to the
xyplot function
R version 3.3.1 (2016-06-21) -- "Bug in Your Hair"
Copyright (C) 2016 The R Foundation for Statistical Computing
Platform: x86_64-pc-linux-gnu (64-bit)
R is free software and comes with ABSOLUTELY NO WARRANTY.
You are welcome to redistribute it under certain conditions.
Type 'license()' or 'licence()' for distribution details.
R is a collaborative project with many contributors.
Type 'contributors()' for more information and
'citation()' on how to cite R or R packages in publications.
Type 'demo()' for some demos, 'help()' for on-line help, or
'help.start()' for an HTML browser interface to help.
Type 'q()' to quit R.
> library(cellGrowth)
Loading required package: locfit
locfit 1.5-9.1 2013-03-22
> png(filename="/home/ddbj/snapshot/RGM3/R_BC/result/cellGrowth/plotPlate.Rd_%03d_medium.png", width=480, height=480)
> ### Name: plotPlate
> ### Title: Plot of a well plate
> ### Aliases: plotPlate
>
> ### ** Examples
>
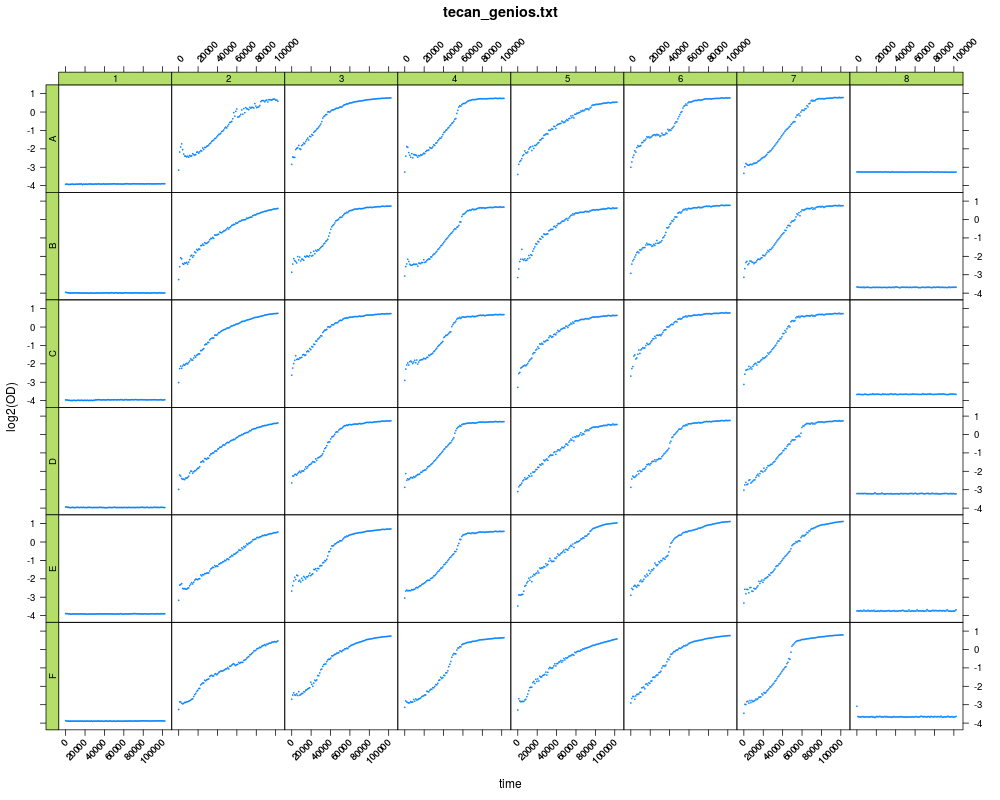
> plotPlate( system.file("extdata", "tecan_genios.txt", package="cellGrowth"), fileParser=readGenios)
>
>
>
>
>
> dev.off()
null device
1
>
 .
.