Supported by Dr. Osamu Ogasawara and  . . |
|
Last data update: 2014.03.03 |
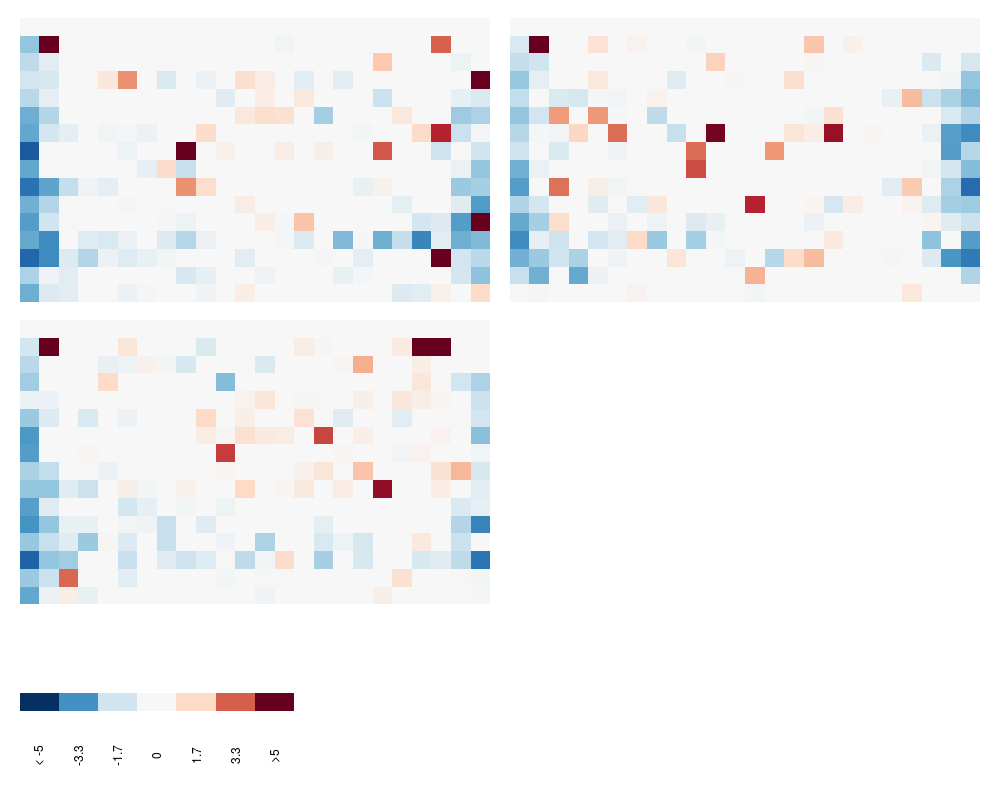
Experiment-wide quality control plot of a cellHTS objectDescriptionExperiment-wide quality control plot of a scored UsageimageScreen(x, ar = 3/5, zrange, map = FALSE, anno) Arguments
DetailsThis function creates an image plot that gives an overview of the whole set of score values
from the
Author(s)Ligia Braz ligia@ebi.ac.uk See Also
Examples
    data(KcViabSmall)
    x <- KcViabSmall
    x <- normalizePlates(x, normalizationMethod="median", zscore="-")
    x <- summarizeReplicates(x)
    imageScreen(x, zrange=c(-5,5))
Results
R version 3.3.1 (2016-06-21) -- "Bug in Your Hair"
Copyright (C) 2016 The R Foundation for Statistical Computing
Platform: x86_64-pc-linux-gnu (64-bit)

R is free software and comes with ABSOLUTELY NO WARRANTY.
You are welcome to redistribute it under certain conditions.
Type 'license()' or 'licence()' for distribution details.

R is a collaborative project with many contributors.
Type 'contributors()' for more information and
'citation()' on how to cite R or R packages in publications.

Type 'demo()' for some demos, 'help()' for on-line help, or
'help.start()' for an HTML browser interface to help.
Type 'q()' to quit R.

> library(cellHTS)
Loading required package: grid
Warning message:
Package 'cellHTS' is deprecated and will be removed from Bioconductor
  version 3.4. Please consider using 'cellHTS2' which offers better
  functionality for working with multiple screens and with
  multi-channel screens.
> png(filename="/home/ddbj/snapshot/RGM3/R_BC/result/cellHTS/imageScreen.Rd_%03d_medium.png", width=480, height=480)
> ### Name: imageScreen
> ### Title: Experiment-wide quality control plot of a cellHTS object
> ### Aliases: imageScreen
> ### Keywords: manip
>
> ### ** Examples
>
>     data(KcViabSmall)
>     x <- KcViabSmall
>     x <- normalizePlates(x, normalizationMethod="median", zscore="-")
>     x <- summarizeReplicates(x)
>     imageScreen(x, zrange=c(-5,5))
>
>
>
>
>
> dev.off()
null device
          1
>
|