Supported by Dr. Osamu Ogasawara and  . . |
|
Last data update: 2014.03.03 |
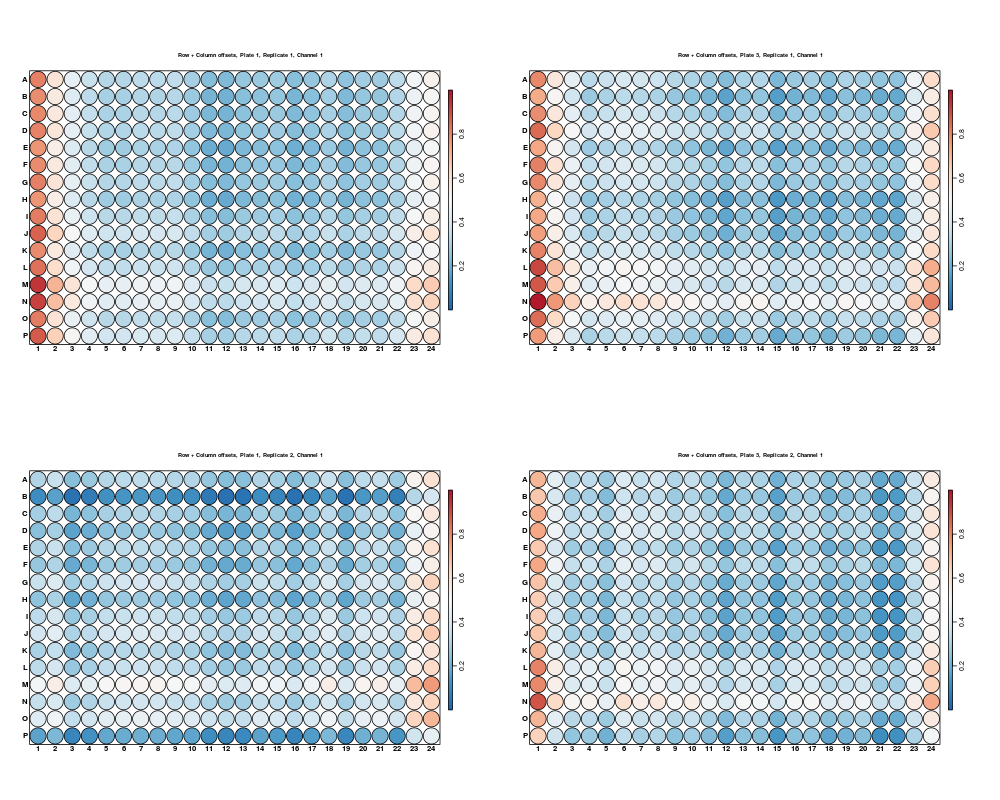
Plate plot with the row and column offsets estimated by the B score methodDescriptionThe function plots the per-plate row and column effects estimated by the B score method. UsageplotSpatialEffects(x, whichChannel = 1, plateRange) Arguments
DetailsThe function plots the plate plots displaying
the row and column offsets (stored in slot yt = (y - min(y))/(max(y) - min(y)) Here, yt are the transformed values, and y the
estimated spatial effects.
The maximum and the minimum values are calculated using all of the values in
Author(s)Ligia P. Bras ligia@ebi.ac.uk See Also
Examples
    data(KcViabSmall)
    x = normalizePlates(KcViabSmall, normalizationMethod="Bscore",
                        save.model = TRUE)
    ## see plate plots with the row and column estimated offsets for
    ## plates 1 and 3:
    plotSpatialEffects(x, plateRange=c(1,3))
Results
R version 3.3.1 (2016-06-21) -- "Bug in Your Hair"
Copyright (C) 2016 The R Foundation for Statistical Computing
Platform: x86_64-pc-linux-gnu (64-bit)

R is free software and comes with ABSOLUTELY NO WARRANTY.
You are welcome to redistribute it under certain conditions.
Type 'license()' or 'licence()' for distribution details.

R is a collaborative project with many contributors.
Type 'contributors()' for more information and
'citation()' on how to cite R or R packages in publications.

Type 'demo()' for some demos, 'help()' for on-line help, or
'help.start()' for an HTML browser interface to help.
Type 'q()' to quit R.

> library(cellHTS)
Loading required package: grid
Warning message:
Package 'cellHTS' is deprecated and will be removed from Bioconductor
  version 3.4. Please consider using 'cellHTS2' which offers better
  functionality for working with multiple screens and with
  multi-channel screens.
> png(filename="/home/ddbj/snapshot/RGM3/R_BC/result/cellHTS/plotSpatialEffects.Rd_%03d_medium.png", width=480, height=480)
> ### Name: plotSpatialEffects
> ### Title: Plate plot with the row and column offsets estimated by the B
> ###   score method
> ### Aliases: plotSpatialEffects
> ### Keywords: manip
>
> ### ** Examples
>
>     data(KcViabSmall)
>     x = normalizePlates(KcViabSmall, normalizationMethod="Bscore",
+                         save.model = TRUE)
>     ## see plate plots with the row and column estimated offsets for
>     ## plates 1 and 3:
>     plotSpatialEffects(x, plateRange=c(1,3))
>
>
>
>
>
> dev.off()
null device
          1
>
|