Supported by Dr. Osamu Ogasawara and  . . |
|
Last data update: 2014.03.03 |
Creates an object of class "ROC" which can be plotted as a ROC curveDescriptionThe function Usage## S4 method for signature 'cellHTS' ROC(object, positives, negatives) ## S4 method for signature 'ROC,missing' plot(x, col="darkblue", type="l", main = "ROC curve", ...) ## S4 method for signature 'ROC' lines(x, ...) Arguments
DetailsThe ValueAn S4 object of class Author(s)Ligia P. Bras ligia@ebi.ac.uk Examples
data(KcViabSmall)
x <- normalizePlates(KcViabSmall, scale="multiplicative", log=FALSE, method="median", varianceAdjust="byExperiment")
x <- scoreReplicates(x, sign="-", method="zscore")
x <- summarizeReplicates(x, summary="mean")
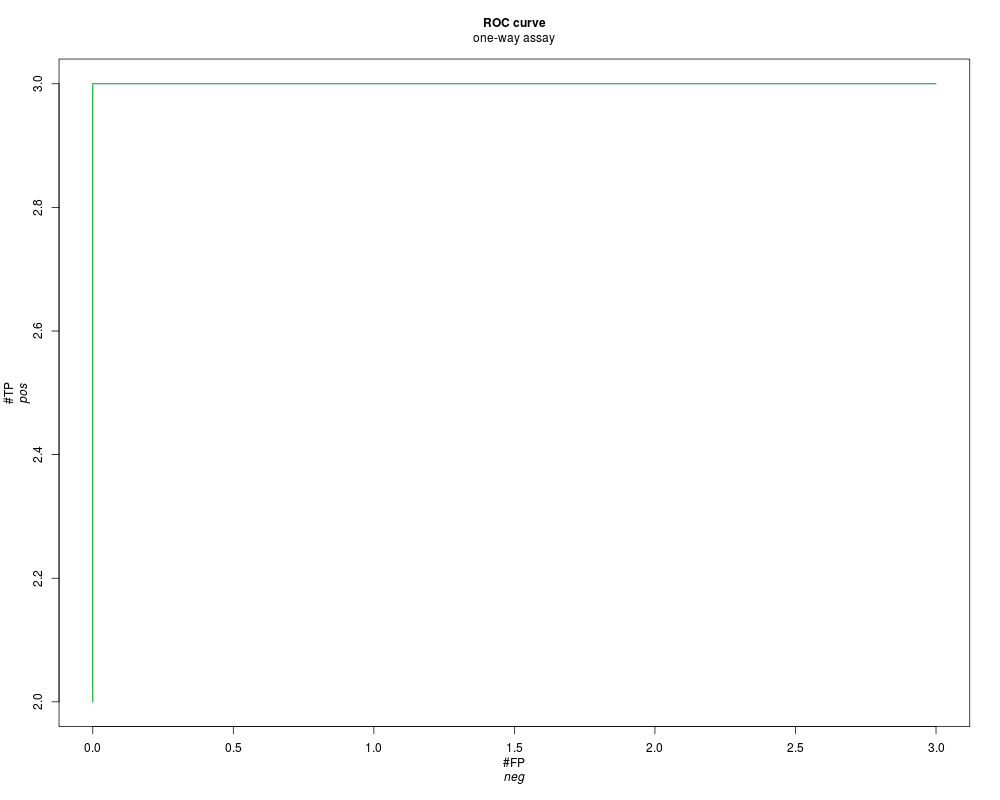
y <- ROC(x)
plot(y)
lines(y, col="green")
show(y)
Results
R version 3.3.1 (2016-06-21) -- "Bug in Your Hair"
Copyright (C) 2016 The R Foundation for Statistical Computing
Platform: x86_64-pc-linux-gnu (64-bit)

R is free software and comes with ABSOLUTELY NO WARRANTY.
You are welcome to redistribute it under certain conditions.
Type 'license()' or 'licence()' for distribution details.

R is a collaborative project with many contributors.
Type 'contributors()' for more information and
'citation()' on how to cite R or R packages in publications.

Type 'demo()' for some demos, 'help()' for on-line help, or
'help.start()' for an HTML browser interface to help.
Type 'q()' to quit R.

> library(cellHTS2)
Loading required package: RColorBrewer
Loading required package: Biobase
Loading required package: BiocGenerics
Loading required package: parallel

Attaching package: 'BiocGenerics'

The following objects are masked from 'package:parallel':

    clusterApply, clusterApplyLB, clusterCall, clusterEvalQ,
    clusterExport, clusterMap, parApply, parCapply, parLapply,
    parLapplyLB, parRapply, parSapply, parSapplyLB

The following objects are masked from 'package:stats':

    IQR, mad, xtabs

The following objects are masked from 'package:base':

    Filter, Find, Map, Position, Reduce, anyDuplicated, append,
    as.data.frame, cbind, colnames, do.call, duplicated, eval, evalq,
    get, grep, grepl, intersect, is.unsorted, lapply, lengths, mapply,
    match, mget, order, paste, pmax, pmax.int, pmin, pmin.int, rank,
    rbind, rownames, sapply, setdiff, sort, table, tapply, union,
    unique, unsplit

Welcome to Bioconductor

    Vignettes contain introductory material; view with
    'browseVignettes()'. To cite Bioconductor, see
    'citation("Biobase")', and for packages 'citation("pkgname")'.

Loading required package: genefilter
Loading required package: splots
Loading required package: vsn
Loading required package: hwriter
Loading required package: locfit
locfit 1.5-9.1 	 2013-03-22
Loading required package: grid
> png(filename="/home/ddbj/snapshot/RGM3/R_BC/result/cellHTS2/ROC.Rd_%03d_medium.png", width=480, height=480)
> ### Name: ROC
> ### Title: Creates an object of class "ROC" which can be plotted as a ROC
> ###   curve
> ### Aliases: ROC ROC,cellHTS-method plot,ROC,missing-method
> ###   lines,ROC-method
> ### Keywords: univar
>
> ### ** Examples
>
>     data(KcViabSmall)
>     x <- normalizePlates(KcViabSmall, scale="multiplicative", log=FALSE, method="median", varianceAdjust="byExperiment")
>     x <- scoreReplicates(x, sign="-", method="zscore")
>     x <- summarizeReplicates(x, summary="mean")
>     y <- ROC(x)
>     plot(y)
>     lines(y, col="green")
>     show(y)
ROC object derived from the 'one-way assay' cellHTS object called 'KcViabSmall'.
Positive control: 'pos'.
Negative control: 'neg'
>
>
>
>
>
> dev.off()
null device
          1
>
|