Supported by Dr. Osamu Ogasawara and  . . |
|
Last data update: 2014.03.03 |
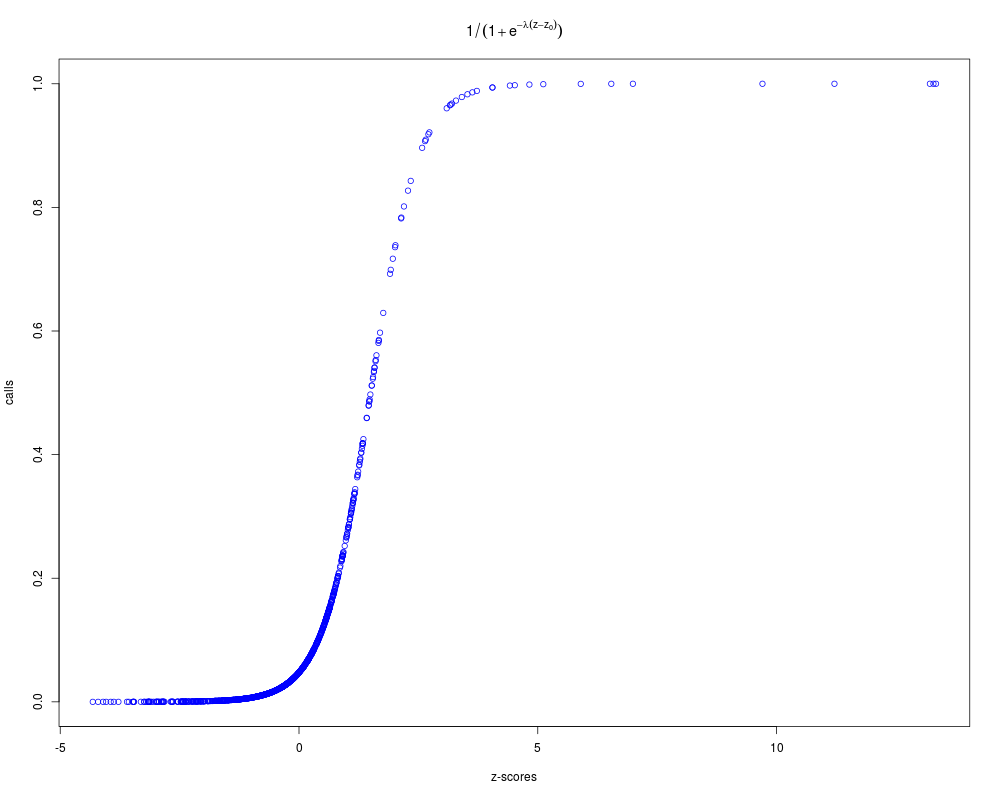
Sigmoidal transformation of the score values stored in a cellHTS object obtaining the call values for each probe.DescriptionApply a sigmoidal transformation with parameters z0 and lambda to the summarized scored values stored in a Currently this function is implemented only for single-color data. Usagescores2calls(x, z0, lambda) Arguments
DetailsThis function applies a sigmoidal transformation with parameters z0 and lambda to the single per-probe score values stored
in a 1 / (1 + exp(-lambda * (z- z0))) where This transformation maps the score values to the interval ValueThe Author(s)W. Huber huber@ebi.ac.uk, Ligia Braz ligia@ebi.ac.uk ReferencesBoutros, M., Bras, L.P. and Huber, W. (2006) Analysis of cell-based RNAi screens, Genome Biology 7, R66. See Also
Examples
data(KcViabSmall)
x <- normalizePlates(KcViabSmall, scale="multiplicative", method="median", varianceAdjust="none")
x <- scoreReplicates(x, sign="-", method="zscore")
x <- summarizeReplicates(x, summary="min")
xc <- scores2calls(x, z0=1.5, lambda=2)
plot(Data(x), Data(xc), col="blue", xlab="z-scores", ylab="calls", main=expression(1/(1+e^{-lambda *(z-z[0])})))
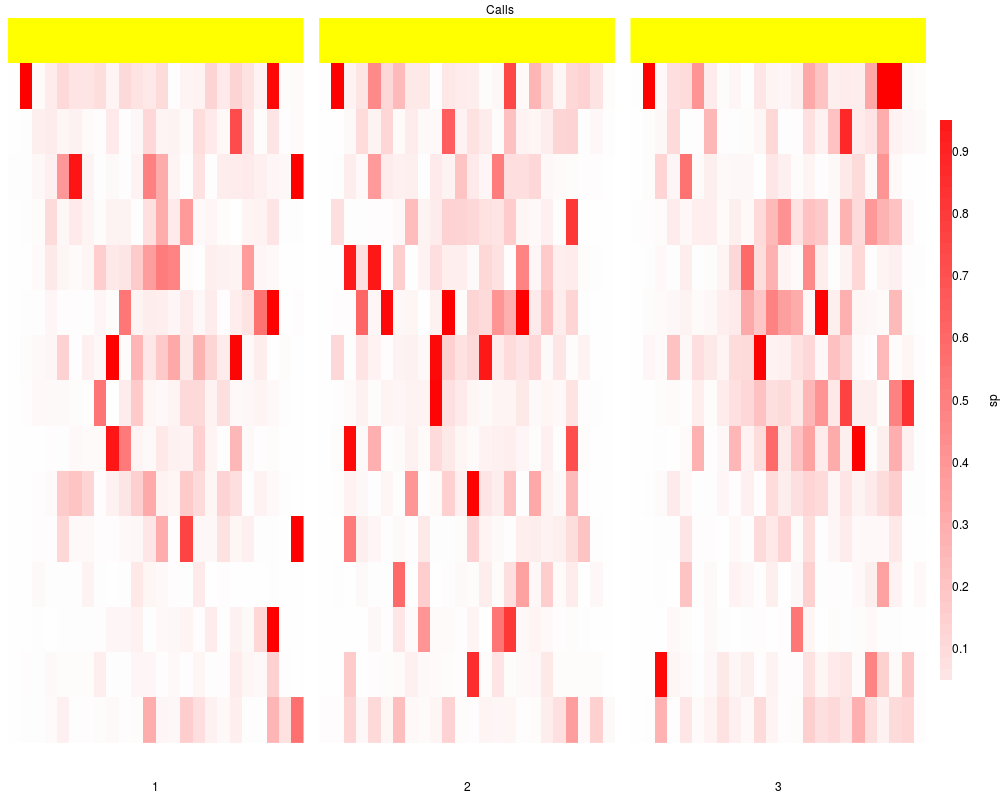
if(require(splots)) {
sp = split(Data(xc), plate(xc))
plotScreen(sp, zrange=c(0,1), fill=c("white", "red"), na.fill="yellow",
main="Calls", ncol=3L)
}
Results
R version 3.3.1 (2016-06-21) -- "Bug in Your Hair"
Copyright (C) 2016 The R Foundation for Statistical Computing
Platform: x86_64-pc-linux-gnu (64-bit)

R is free software and comes with ABSOLUTELY NO WARRANTY.
You are welcome to redistribute it under certain conditions.
Type 'license()' or 'licence()' for distribution details.

R is a collaborative project with many contributors.
Type 'contributors()' for more information and
'citation()' on how to cite R or R packages in publications.

Type 'demo()' for some demos, 'help()' for on-line help, or
'help.start()' for an HTML browser interface to help.
Type 'q()' to quit R.

> library(cellHTS2)
Loading required package: RColorBrewer
Loading required package: Biobase
Loading required package: BiocGenerics
Loading required package: parallel

Attaching package: 'BiocGenerics'

The following objects are masked from 'package:parallel':

    clusterApply, clusterApplyLB, clusterCall, clusterEvalQ,
    clusterExport, clusterMap, parApply, parCapply, parLapply,
    parLapplyLB, parRapply, parSapply, parSapplyLB

The following objects are masked from 'package:stats':

    IQR, mad, xtabs

The following objects are masked from 'package:base':

    Filter, Find, Map, Position, Reduce, anyDuplicated, append,
    as.data.frame, cbind, colnames, do.call, duplicated, eval, evalq,
    get, grep, grepl, intersect, is.unsorted, lapply, lengths, mapply,
    match, mget, order, paste, pmax, pmax.int, pmin, pmin.int, rank,
    rbind, rownames, sapply, setdiff, sort, table, tapply, union,
    unique, unsplit

Welcome to Bioconductor

    Vignettes contain introductory material; view with
    'browseVignettes()'. To cite Bioconductor, see
    'citation("Biobase")', and for packages 'citation("pkgname")'.

Loading required package: genefilter
Loading required package: splots
Loading required package: vsn
Loading required package: hwriter
Loading required package: locfit
locfit 1.5-9.1 	 2013-03-22
Loading required package: grid
> png(filename="/home/ddbj/snapshot/RGM3/R_BC/result/cellHTS2/scores2calls.Rd_%03d_medium.png", width=480, height=480)
> ### Name: scores2calls
> ### Title: Sigmoidal transformation of the score values stored in a cellHTS
> ###   object obtaining the call values for each probe.
> ### Aliases: scores2calls
> ### Keywords: manip
>
> ### ** Examples
>
>     data(KcViabSmall)
>     x <- normalizePlates(KcViabSmall, scale="multiplicative", method="median", varianceAdjust="none")
>     x <- scoreReplicates(x, sign="-", method="zscore")
>     x <- summarizeReplicates(x, summary="min")
>     xc <- scores2calls(x, z0=1.5, lambda=2)
>     plot(Data(x), Data(xc), col="blue", xlab="z-scores", ylab="calls", main=expression(1/(1+e^{-lambda *(z-z[0])})))
>     if(require(splots)) {
+      sp = split(Data(xc), plate(xc))
+      plotScreen(sp, zrange=c(0,1), fill=c("white", "red"), na.fill="yellow",
+                main="Calls", ncol=3L)
+     }
>
>
>
>
>
> dev.off()
null device
          1
>
|