Supported by Dr. Osamu Ogasawara and  . . |
|
Last data update: 2014.03.03 |
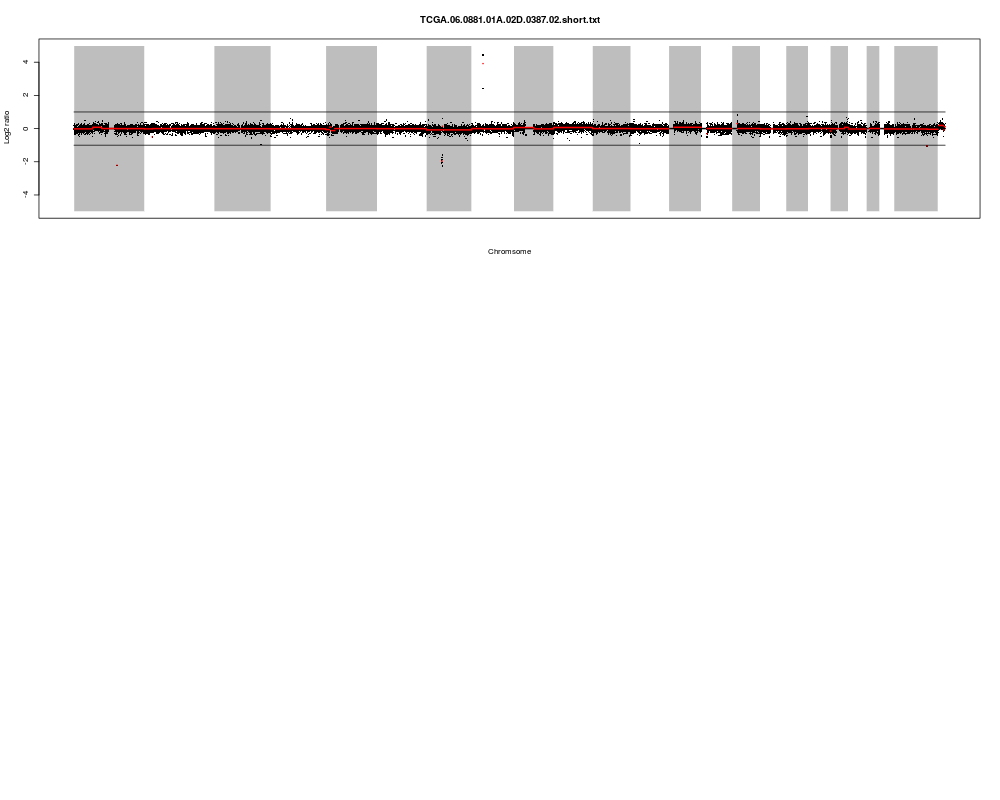
A function to plot the original data along with the segments identified using segment of DNAcopy.DescriptionThis function takes a DNAcopy object generated by
running Usage## S3 method for class 'DNAcopy' plot(x, ..., save = FALSE, layout) Arguments
DetailsThis function only works with the DNAcopy returned by
ValueThis function returns invisible() or the name of the plot depending on whether save is set to FALSE of TRUE. NoteThe function is a contribution of The Center for Applied Cancer Science of Dana-Farber Cancer Institute Author(s)Jianhua Zhang ReferencesThe DNAcopy package See Also
Examples
  if(interactive()){
    require("cghMCR")
    data("segData")
    plot(segData)
  }
Results
R version 3.3.1 (2016-06-21) -- "Bug in Your Hair"
Copyright (C) 2016 The R Foundation for Statistical Computing
Platform: x86_64-pc-linux-gnu (64-bit)

R is free software and comes with ABSOLUTELY NO WARRANTY.
You are welcome to redistribute it under certain conditions.
Type 'license()' or 'licence()' for distribution details.

R is a collaborative project with many contributors.
Type 'contributors()' for more information and
'citation()' on how to cite R or R packages in publications.

Type 'demo()' for some demos, 'help()' for on-line help, or
'help.start()' for an HTML browser interface to help.
Type 'q()' to quit R.

> library(cghMCR)
Loading required package: DNAcopy
Loading required package: CNTools
Loading required package: tools
Loading required package: genefilter
Loading required package: limma
> png(filename="/home/ddbj/snapshot/RGM3/R_BC/result/cghMCR/plot.DNAcopy.Rd_%03d_medium.png", width=480, height=480)
> ### Name: plot.DNAcopy
> ### Title: A function to plot the original data along with the segments
> ###   identified using segment of DNAcopy.
> ### Aliases: plot.DNAcopy
> ### Keywords: hplot
>
> ### ** Examples
>
> #  if(interactive()){
>     require("cghMCR")
>     data("segData")
>     plot(segData)
Error in xy.coords(x, y) : argument "min" is missing, with no default
Calls: plot ... plot.DNAcopy -> <Anonymous> -> polygon -> xy.coords
Execution halted
|