Supported by Dr. Osamu Ogasawara and  . . |
|
Last data update: 2014.03.03 |
A function to plot the coverage of a fusion geneDescriptionA function to plot the coverage of a fusion gene. UsageplotCoverage(fset, plot.type=c("exons","junctions"), junction.spanning=20, fusion.only=FALSE, xlab="nts", ylab="Coverage", main="", col.box1="red", col.box2="green", ybox.lim=c(-4,-1))
Arguments
Author(s)Raffaele A Calogero See Also
Examples
tmp <- importFusionData("fusionmap", paste(find.package(package="chimera"),"/examples/mcf7.FMFusionReport", sep=""), org="hg19")
fusion.names <- fusionName(tmp)
fusion.names
myset <- tmp[[13]]
trs <- chimeraSeqs(myset, type="transcripts")
myset <- addRNA(myset , trs)
tmp.seq <- fusionRNA(myset)
myset <- addGA(myset, paste(path.package(package="chimera"),"/examples/mcf7_trs_accepted_hits.bam",sep=""))
ga <- fusionGA(myset)
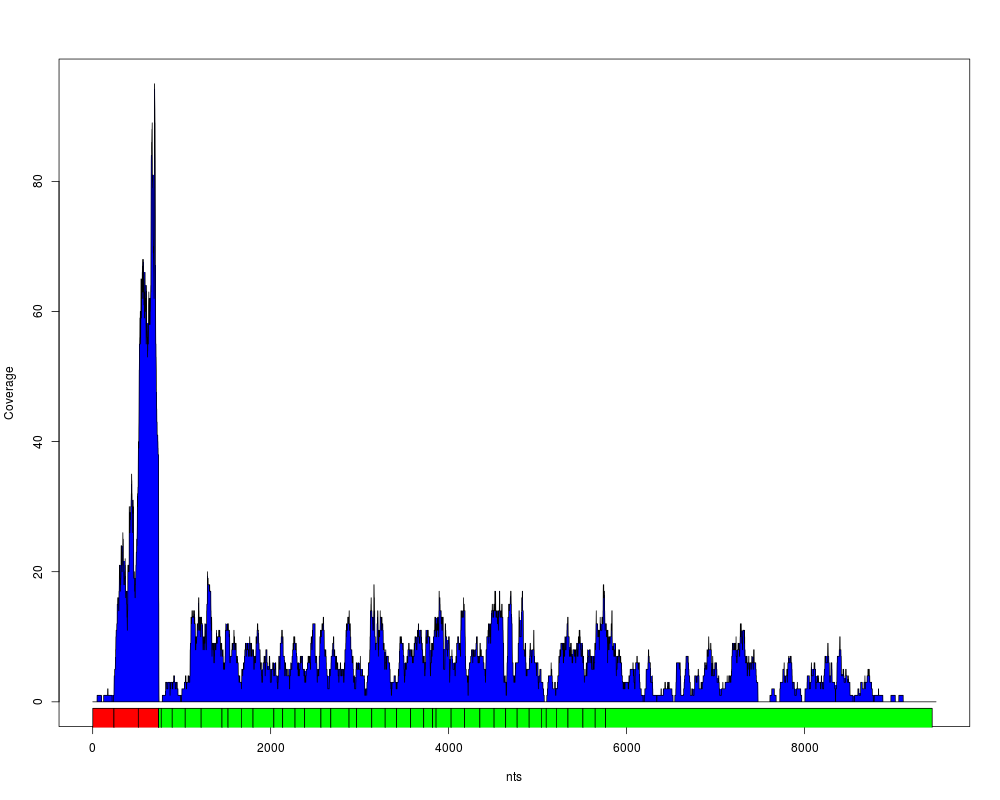
plotCoverage(myset, plot.type="exons", col.box1="red", col.box2="green", ybox.lim=c(-4,-1))
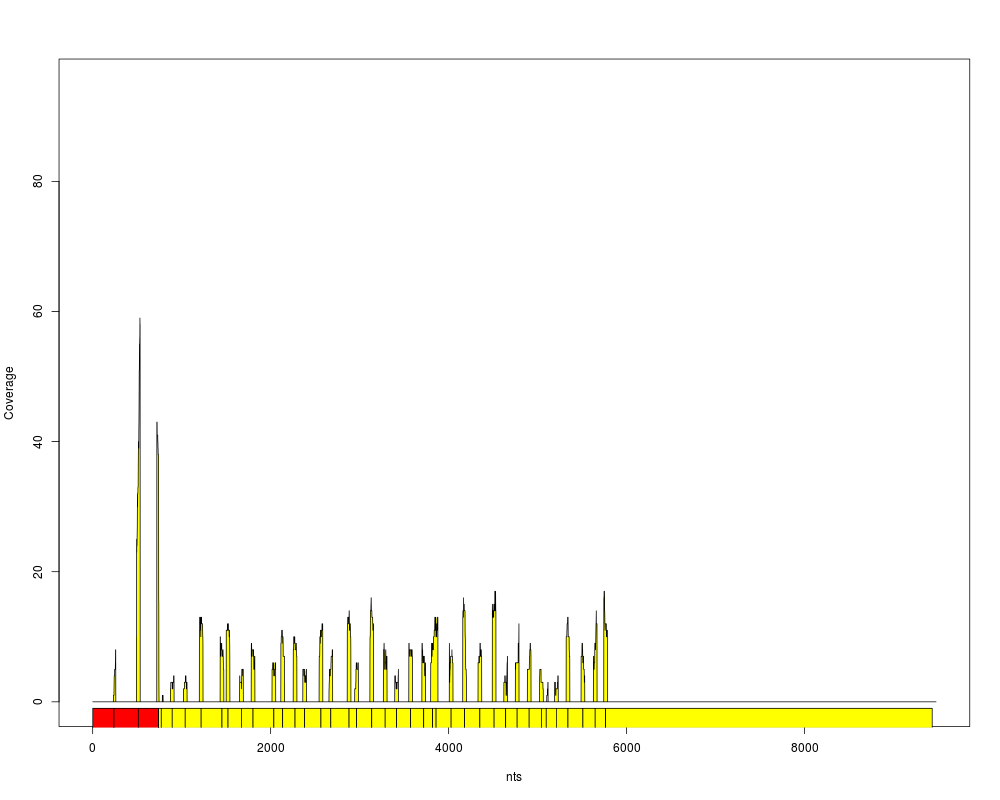
plotCoverage(myset, plot.type="junctions", col.box1="red", col.box2="yellow", ybox.lim=c(-4,-1))
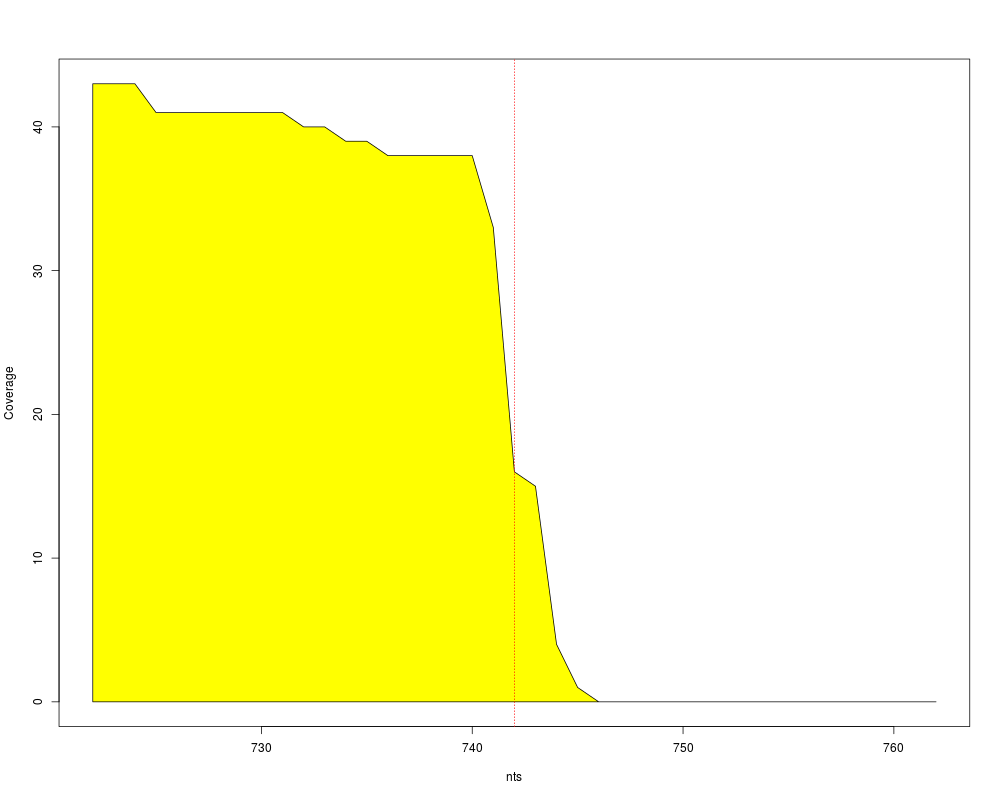
plotCoverage(myset, fusion.only=TRUE, col.box1="red", col.box2="yellow", ybox.lim=c(-4,-1))
Results
R version 3.3.1 (2016-06-21) -- "Bug in Your Hair"
Copyright (C) 2016 The R Foundation for Statistical Computing
Platform: x86_64-pc-linux-gnu (64-bit)

R is free software and comes with ABSOLUTELY NO WARRANTY.
You are welcome to redistribute it under certain conditions.
Type 'license()' or 'licence()' for distribution details.

R is a collaborative project with many contributors.
Type 'contributors()' for more information and
'citation()' on how to cite R or R packages in publications.

Type 'demo()' for some demos, 'help()' for on-line help, or
'help.start()' for an HTML browser interface to help.
Type 'q()' to quit R.

> library(chimera)
Loading required package: Biobase
Loading required package: BiocGenerics
Loading required package: parallel

Attaching package: 'BiocGenerics'

The following objects are masked from 'package:parallel':

    clusterApply, clusterApplyLB, clusterCall, clusterEvalQ,
    clusterExport, clusterMap, parApply, parCapply, parLapply,
    parLapplyLB, parRapply, parSapply, parSapplyLB

The following objects are masked from 'package:stats':

    IQR, mad, xtabs

The following objects are masked from 'package:base':

    Filter, Find, Map, Position, Reduce, anyDuplicated, append,
    as.data.frame, cbind, colnames, do.call, duplicated, eval, evalq,
    get, grep, grepl, intersect, is.unsorted, lapply, lengths, mapply,
    match, mget, order, paste, pmax, pmax.int, pmin, pmin.int, rank,
    rbind, rownames, sapply, setdiff, sort, table, tapply, union,
    unique, unsplit

Welcome to Bioconductor

    Vignettes contain introductory material; view with
    'browseVignettes()'. To cite Bioconductor, see
    'citation("Biobase")', and for packages 'citation("pkgname")'.

Loading required package: GenomicRanges
Loading required package: S4Vectors
Loading required package: stats4

Attaching package: 'S4Vectors'

The following objects are masked from 'package:base':

    colMeans, colSums, expand.grid, rowMeans, rowSums

Loading required package: IRanges
Loading required package: GenomeInfoDb
Loading required package: Rsamtools
Loading required package: Biostrings
Loading required package: XVector
Loading required package: GenomicAlignments
Loading required package: SummarizedExperiment
Loading required package: AnnotationDbi
Loading required package: BSgenome.Hsapiens.UCSC.hg19
Loading required package: BSgenome
Loading required package: rtracklayer
Loading required package: TxDb.Hsapiens.UCSC.hg19.knownGene
Loading required package: GenomicFeatures
Loading required package: Homo.sapiens
Loading required package: OrganismDbi
Loading required package: GO.db

Loading required package: org.Hs.eg.db

> png(filename="/home/ddbj/snapshot/RGM3/R_BC/result/chimera/plotCoverage.Rd_%03d_medium.png", width=480, height=480)
> ### Name: plotCoverage
> ### Title: A function to plot the coverage of a fusion gene
> ### Aliases: plotCoverage
> ### Keywords: utilities
>
> ### ** Examples
>
> 	tmp <- importFusionData("fusionmap", paste(find.package(package="chimera"),"/examples/mcf7.FMFusionReport", sep=""), org="hg19")
'select()' returned 1:1 mapping between keys and columns
> 	fusion.names <- fusionName(tmp)
> 	fusion.names
 [1] "HMGN2:ESYT1"                  "CC2D1B:DTYMK"
 [3] "NOS1AP:C1orf226"              "GREB1:GREB1"
 [5] "RYBP:YAF2"                    "SLC30A5:AZIN1"
 [7] "chr6:30691425-30691455:KRT80" "EEF1A1:GHITM"
 [9] "HNRNPK:AATF"                  "NDUFA1:SYNJ2BP-COX16"
[11] "FAM208B:FAM208B"              "YLPM1:ITPK1"
[13] "SULF2:ARFGEF2"
> 	myset <- tmp[[13]]
> 	trs <- chimeraSeqs(myset, type="transcripts")
> 	myset <- addRNA(myset , trs)
> 	tmp.seq <- fusionRNA(myset)
> 	myset <- addGA(myset, paste(path.package(package="chimera"),"/examples/mcf7_trs_accepted_hits.bam",sep=""))
> 	ga <- fusionGA(myset)
> 	plotCoverage(myset, plot.type="exons", col.box1="red", col.box2="green", ybox.lim=c(-4,-1))
> 	plotCoverage(myset, plot.type="junctions", col.box1="red", col.box2="yellow", ybox.lim=c(-4,-1))
> 	plotCoverage(myset, fusion.only=TRUE, col.box1="red", col.box2="yellow", ybox.lim=c(-4,-1))
>
>
>
>
>
>
> dev.off()
null device
          1
>
|
Created & Maintained by Osamu Ogasawara (osamu.ogasawara@gmail.com) and 