Supported by Dr. Osamu Ogasawara and  . . |
|
Last data update: 2014.03.03 |
1-df and 2-df tests for genetic associations with SNPsDescriptionThis function carries out tests for association between phenotype and a series of single nucleotide polymorphisms (SNPs), within strata defined by a possibly confounding factor. SNPs are considered one at a time and both 1-df and 2-df tests are calculated. For a binary phenotype, the 1-df test is the Cochran-Armitage test (or, when stratified, the Mantel-extension test). Usagesingle.snp.tests(phenotype, stratum, data = sys.parent(), snp.data, subset, snp.subset) Arguments
DetailsFormally, the test statistics are score tests for generalized linear models with canonical link. That is, they are inner products between genotype indicators and the deviations of phenotypes from their stratum means. Variances (and covariances) are those of the permutation distribution obtained by randomly permuting phenotype within stratum. The ValueA dataframe, with columns
NoteThe behaviour of this function for objects of class
Author(s)David Clayton david.clayton@cimr.cam.ac.uk ReferencesClayton (2008) Testing for association on the X chromosome Biostatistics (In press) See Also
Examples
data(testdata)
results <- single.snp.tests(cc, stratum=region, data=subject.data,
snp.data=Autosomes, snp.subset=1:10)
summary(results)
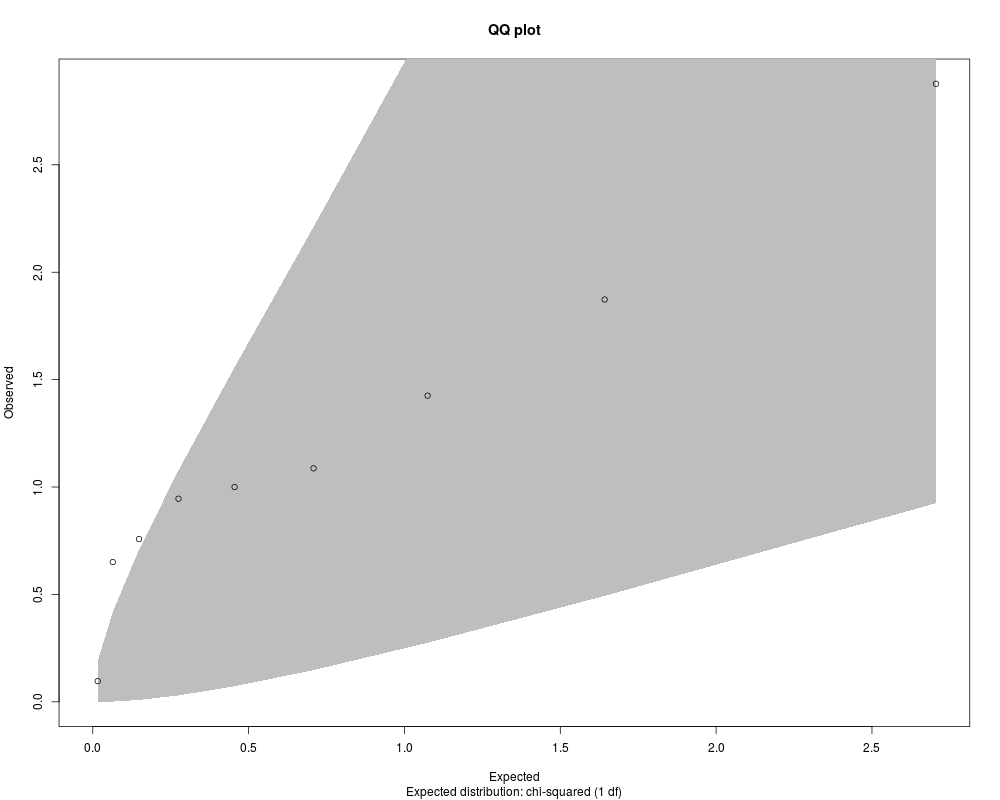
# QQ plot - see code{link{qq.chisq}}
qq.chisq(results$chi2.1df)
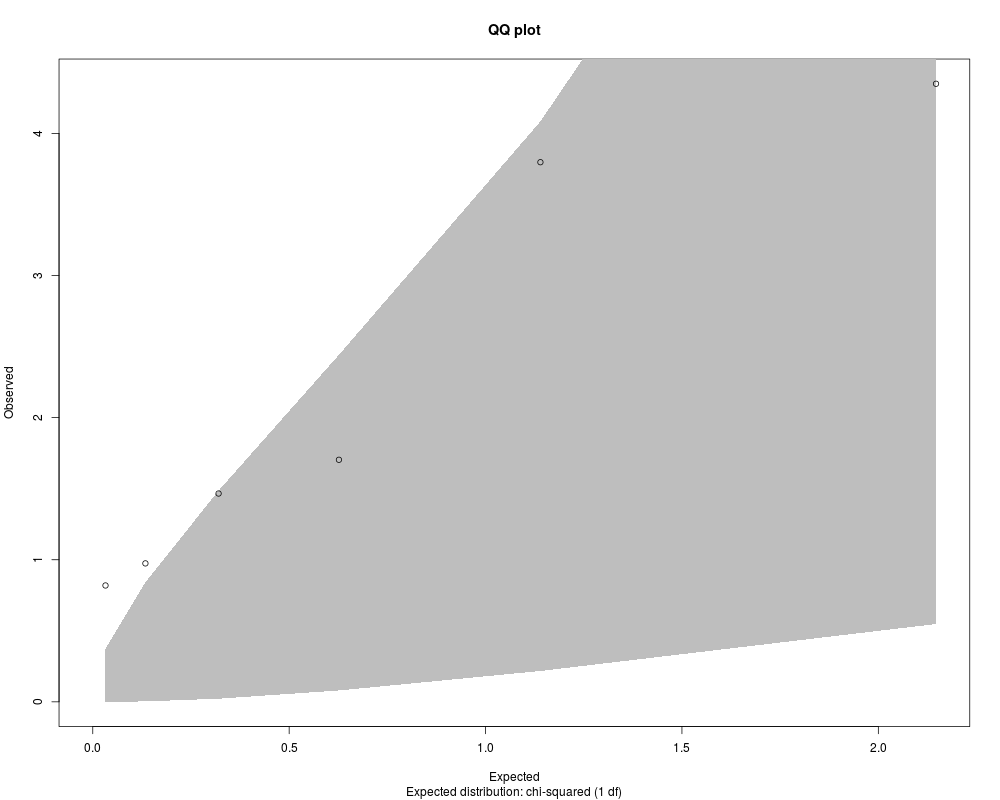
qq.chisq(results$chi2.2df)
Results
R version 3.3.1 (2016-06-21) -- "Bug in Your Hair"
Copyright (C) 2016 The R Foundation for Statistical Computing
Platform: x86_64-pc-linux-gnu (64-bit)

R is free software and comes with ABSOLUTELY NO WARRANTY.
You are welcome to redistribute it under certain conditions.
Type 'license()' or 'licence()' for distribution details.

R is a collaborative project with many contributors.
Type 'contributors()' for more information and
'citation()' on how to cite R or R packages in publications.

Type 'demo()' for some demos, 'help()' for on-line help, or
'help.start()' for an HTML browser interface to help.
Type 'q()' to quit R.

> library(chopsticks)
Loading required package: survival
> png(filename="/home/ddbj/snapshot/RGM3/R_BC/result/chopsticks/single.snp.tests.Rd_%03d_medium.png", width=480, height=480)
> ### Name: single.snp.tests
> ### Title: 1-df and 2-df tests for genetic associations with SNPs
> ### Aliases: single.snp.tests
> ### Keywords: htest
>
> ### ** Examples
>
> data(testdata)
> results <- single.snp.tests(cc, stratum=region, data=subject.data,
+    snp.data=Autosomes, snp.subset=1:10)
> summary(results)
    chi2.1df         chi2.2df          p.1df             p.2df
 Min.   :0.0963   Min.   :0.8189   Min.   :0.08984   Min.   :0.1136
 1st Qu.:0.7577   1st Qu.:1.0972   1st Qu.:0.23253   1st Qu.:0.2190
 Median :1.0000   Median :1.5847   Median :0.31731   Median :0.4536
 Mean   :1.1903   Mean   :2.1849   Mean   :0.33322   Mean   :0.4082
 3rd Qu.:1.4253   3rd Qu.:3.2740   3rd Qu.:0.38406   3rd Qu.:0.5809
 Max.   :2.8773   Max.   :4.3497   Max.   :0.75631   Max.   :0.6640
 NA's   :1        NA's   :4        NA's   :1         NA's   :4
       N
 Min.   :378.0
 1st Qu.:396.2
 Median :398.5
 Mean   :395.6
 3rd Qu.:400.0
 Max.   :400.0

> # QQ plot - see code{qq.chisq}
> qq.chisq(results$chi2.1df)
       N  omitted   lambda
9.000000 0.000000 4.867221
> qq.chisq(results$chi2.2df)
      N omitted  lambda
6.00000 0.00000 6.69583
>
>
>
>
>
> dev.off()
null device
          1
>
|