Supported by Dr. Osamu Ogasawara and  . . |
|
Last data update: 2014.03.03 |
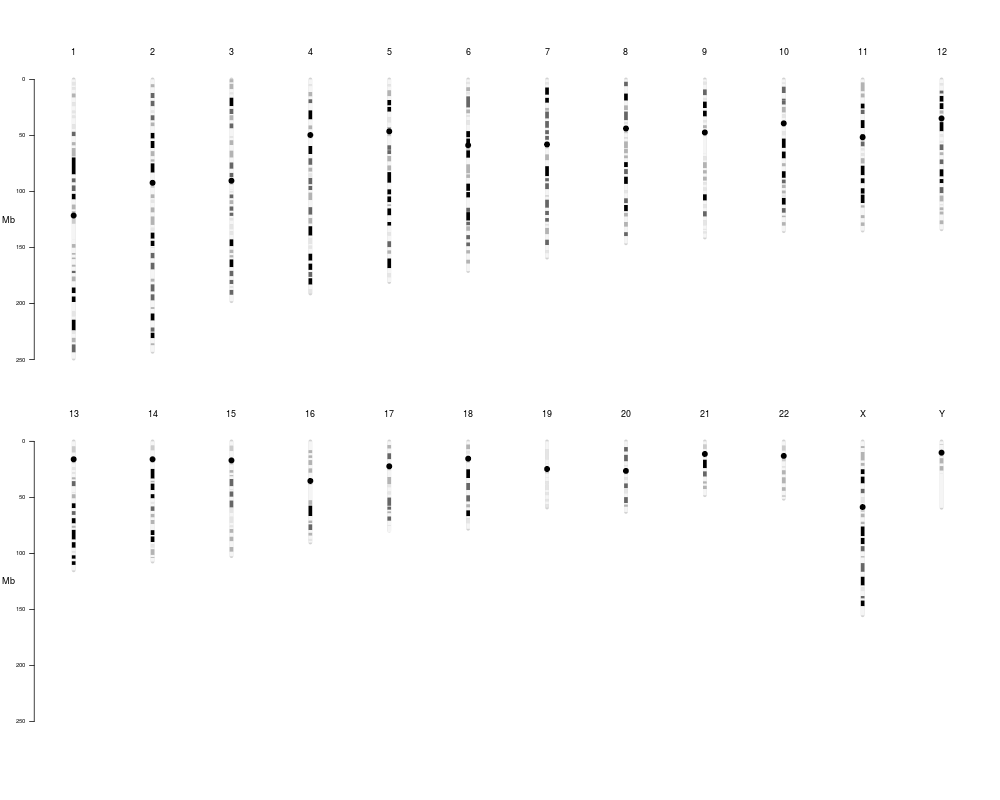
Global visualization tool of genomic dataDescriptionPackage designed to visualize genomic data along the chromosomes,
where the vertical chromosomes are sorted by number, with sex chromosomes
at the end. Usage
chromPlot(annot1, annot2, annot3, annot4, stat, stat2,
scale.title="Counts", statTyp="p", scex=1, spty=20, statCol, statCol2,
statName="Statistic", statName2="Statistic2", bands, bandsDesc, gaps,
gapsDesc, segment, segmentDesc, segment2=NULL, segment2Desc=NULL, chr,
bin=1e6, yAxis=TRUE, figCols=NULL, colBand="lightgray", colAnnot1="brown",
colAnnot2="gold", colAnnot3="darkgreen", colAnnot4="blue", colSegments=c("darkgreen",
"orange", "blue",  "darkslategray2", "cyan", "blueviolet", "goldenrod3", "darkseagreen4",
"red", "green", "salmon", "darkolivegreen", "maroon", "purple"),
colSegments2=colSegments[-1L], colStat="blue", colStat2="orange", title=NULL,
plotRndchr=FALSE, maxSegs=200, noHist=FALSE, segLwd=3, sortSegs=TRUE,
chrSide=c(-1, -1, -1, -1, 1, 1, -1, 1), cex=0.75, legChrom, org=NULL, strand=NULL,
stack=TRUE, statThreshold=NULL, statThreshold2=NULL, statSumm="none")
Arguments
DetailschromPlot package creates an idiogram with all chromosomes including the sex chromosomes. The package is able to plot genomic data on both sides of chromosome as histograms or vertical segments. Histograms represent the number of genomic elements in each bin of size bin. The parameters annot1, annot2, annot3, annot4, segment, segment2, stat, stat2, band, gaps should be data.frames with at leas these columns: 'Chrom', 'Start', 'End'. The gaps and bands arguments are used to plot the chromosomal ideogram.The argument band should also have a 'Group' column with categories for classifying each annotation element. Arguments stat and stat2 should have a statCol and stat2Col column respectively with continuoos values. If plotted on the same chromosomal side, tracks will be plotted on top of each other, in the order they are in the function's syntax. This can be used for plotting stacked barplots if, for instance, annot1, annot2, annot3, and annot4 are supersets of ecah other. This, however, is not enforced nor checked. An alternative way to create a stacked histogram is providing a single track with Group category. The user can modify the side tracks are plotted on by modifying chrSide. The segment and segment2 tracks are plotted as vertical bars by default. However, the their elements exceed in number given to maxSegs or if the maximum segment size is smaller than bin, they are plotted as histograms. This behaviour can be modified by setting noHist = TRUE. For more details and usage examples see the vignette. ValueKaryotype diagram in device. Author(s)Ricardo Verdugo and Karen Orostica Examplesdata(hg_cytoBandIdeo) data(hg_gap) chromPlot(bands=hg_cytoBandIdeo, gaps=hg_gap) Results
R version 3.3.1 (2016-06-21) -- "Bug in Your Hair"
Copyright (C) 2016 The R Foundation for Statistical Computing
Platform: x86_64-pc-linux-gnu (64-bit)

R is free software and comes with ABSOLUTELY NO WARRANTY.
You are welcome to redistribute it under certain conditions.
Type 'license()' or 'licence()' for distribution details.

R is a collaborative project with many contributors.
Type 'contributors()' for more information and
'citation()' on how to cite R or R packages in publications.

Type 'demo()' for some demos, 'help()' for on-line help, or
'help.start()' for an HTML browser interface to help.
Type 'q()' to quit R.

> library(chromPlot)
Loading required package: biomaRt
Loading required package: GenomicRanges
Loading required package: BiocGenerics
Loading required package: parallel

Attaching package: 'BiocGenerics'

The following objects are masked from 'package:parallel':

    clusterApply, clusterApplyLB, clusterCall, clusterEvalQ,
    clusterExport, clusterMap, parApply, parCapply, parLapply,
    parLapplyLB, parRapply, parSapply, parSapplyLB

The following objects are masked from 'package:stats':

    IQR, mad, xtabs

The following objects are masked from 'package:base':

    Filter, Find, Map, Position, Reduce, anyDuplicated, append,
    as.data.frame, cbind, colnames, do.call, duplicated, eval, evalq,
    get, grep, grepl, intersect, is.unsorted, lapply, lengths, mapply,
    match, mget, order, paste, pmax, pmax.int, pmin, pmin.int, rank,
    rbind, rownames, sapply, setdiff, sort, table, tapply, union,
    unique, unsplit

Loading required package: S4Vectors
Loading required package: stats4

Attaching package: 'S4Vectors'

The following objects are masked from 'package:base':

    colMeans, colSums, expand.grid, rowMeans, rowSums

Loading required package: IRanges
Loading required package: GenomeInfoDb
> png(filename="/home/ddbj/snapshot/RGM3/R_BC/result/chromPlot/chromPlot.Rd_%03d_medium.png", width=480, height=480)
> ### Name: chromPlot
> ### Title: Global visualization tool of genomic data
> ### Aliases: chromPlot
> ### Keywords: Histograms
>
> ### ** Examples
>
> data(hg_cytoBandIdeo)
> data(hg_gap)
> chromPlot(bands=hg_cytoBandIdeo, gaps=hg_gap)
Chrom 1 : 249250621 bp
Chrom 2 : 243199373 bp
Chrom 3 : 198022430 bp
Chrom 4 : 191154276 bp
Chrom 5 : 180915260 bp
Chrom 6 : 171115067 bp
Chrom 7 : 159138663 bp
Chrom 8 : 146364022 bp
Chrom 9 : 141213431 bp
Chrom 10 : 135534747 bp
Chrom 11 : 135006516 bp
Chrom 12 : 133851895 bp
Chrom 13 : 115169878 bp
Chrom 14 : 107349540 bp
Chrom 15 : 102531392 bp
Chrom 16 : 90354753 bp
Chrom 17 : 79759049 bp
Chrom 18 : 78077248 bp
Chrom 19 : 59128983 bp
Chrom 20 : 63025520 bp
Chrom 21 : 48129895 bp
Chrom 22 : 51304566 bp
Chrom X : 155270560 bp
Chrom Y : 59373566 bp
>
>
>
>
>
>
>
> dev.off()
null device
          1
>
|