Supported by Dr. Osamu Ogasawara and  . . |
|
Last data update: 2014.03.03 |
Create a table count of clonotypes or other features.DescriptionUsing a clonotype data frame loaded with Usage
clonotype_table(libs, feats=c("V","pep","J"), data, filter=(data$unproductive | data$ambiguous), minscore=0, minqual=1, sample=FALSE)
Arguments
Value
Author(s)Charles Plessy See Also
Examples
# Read the package's example data
clonotypes <- read_clonotypes(system.file('extdata', 'clonotypes.txt.gz', package = "clonotypeR"))
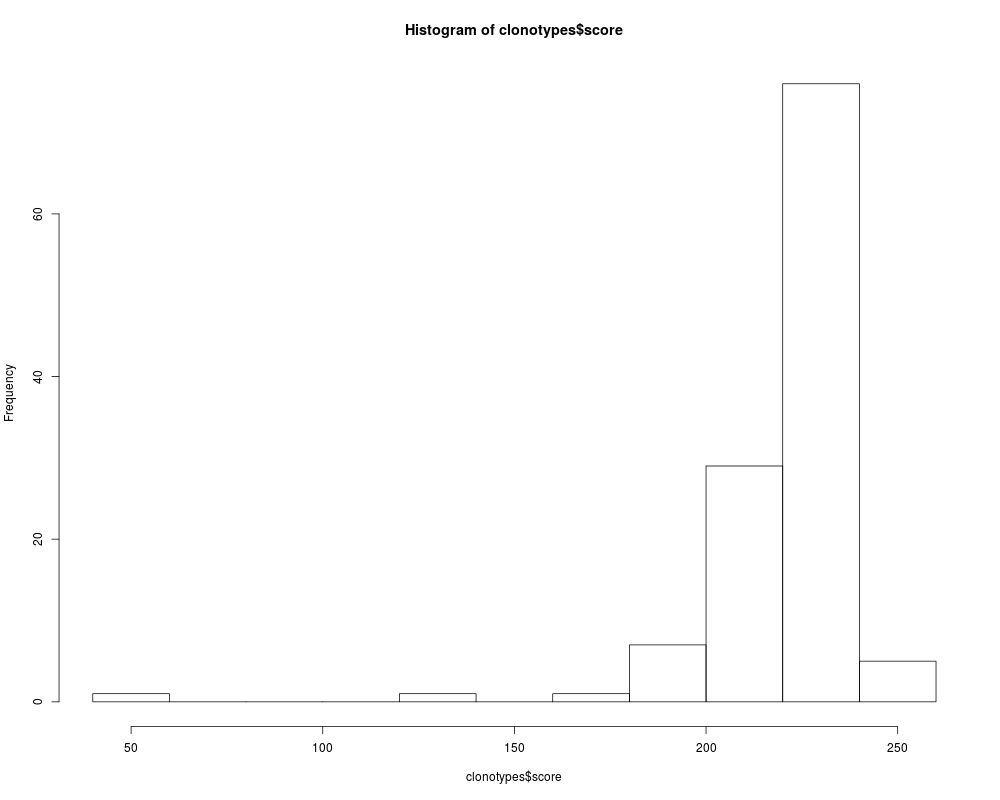
# Inspect the alignment scores
hist(clonotypes$score)
# Count J segments
j <- clonotype_table(levels(clonotypes$lib), "J", data=clonotypes)
# Normalise counts in parts per million
J <- data.frame(prop.table(as.matrix(j),2) * 1000000)
Results
R version 3.3.1 (2016-06-21) -- "Bug in Your Hair"
Copyright (C) 2016 The R Foundation for Statistical Computing
Platform: x86_64-pc-linux-gnu (64-bit)

R is free software and comes with ABSOLUTELY NO WARRANTY.
You are welcome to redistribute it under certain conditions.
Type 'license()' or 'licence()' for distribution details.

R is a collaborative project with many contributors.
Type 'contributors()' for more information and
'citation()' on how to cite R or R packages in publications.

Type 'demo()' for some demos, 'help()' for on-line help, or
'help.start()' for an HTML browser interface to help.
Type 'q()' to quit R.

> library(clonotypeR)
> png(filename="/home/ddbj/snapshot/RGM3/R_BC/result/clonotypeR/clonotype_table.Rd_%03d_medium.png", width=480, height=480)
> ### Name: clonotype_table
> ### Title: Create a table count of clonotypes or other features.
> ### Aliases: clonotype_table
> ### Keywords: clonotype
>
> ### ** Examples
>
> # Read the package's example data
> clonotypes <- read_clonotypes(system.file('extdata', 'clonotypes.txt.gz', package = "clonotypeR"))
>
> # Inspect the alignment scores
> hist(clonotypes$score)
>
> # Count J segments
> j <- clonotype_table(levels(clonotypes$lib), "J", data=clonotypes)
>
> # Normalise counts in parts per million
> J <- data.frame(prop.table(as.matrix(j),2) * 1000000)
>
>
>
>
>
> dev.off()
null device
          1
>
|