Supported by Dr. Osamu Ogasawara and  . . |
|
Last data update: 2014.03.03 |
Visualize results of
|
distances |
The |
breaks |
The |
D |
The distance threshold |
interval |
The range of values over which candidiate values of PMMI are evaluated. |
xlab |
Label the x axis of the plot. |
ylab |
Label the y axis of the plot. |
... |
Additional arguments are passed to |
(plotMutinfo)
Details
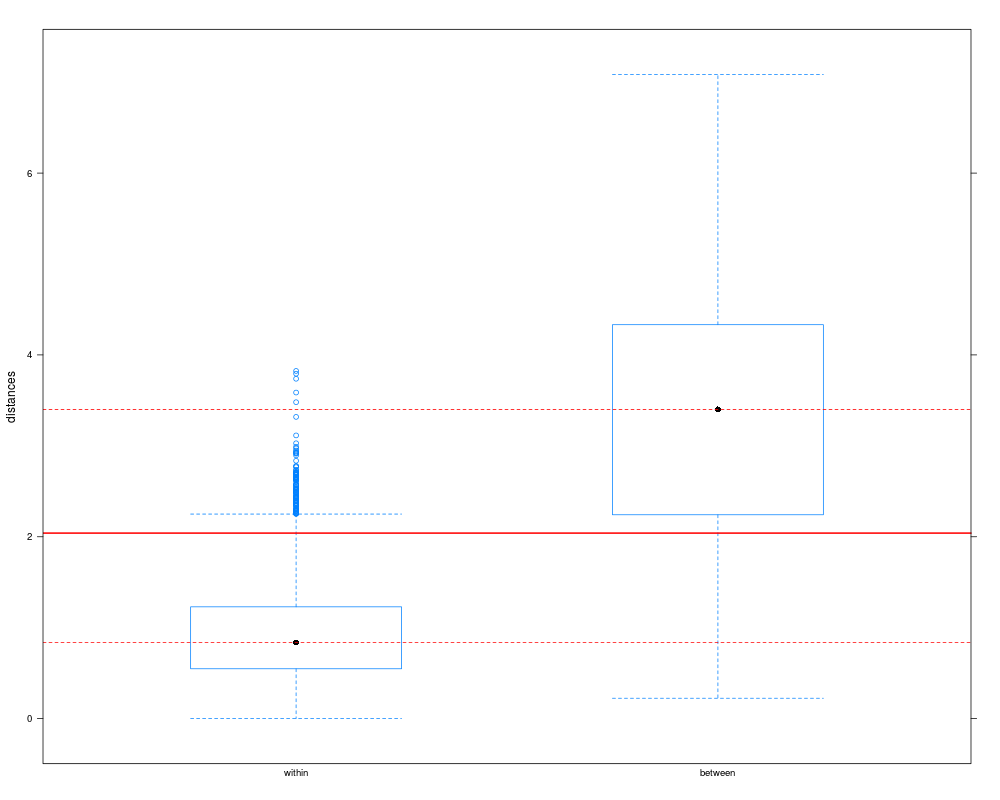
plotDistances produces a box-and-whisker plot contrasting within-
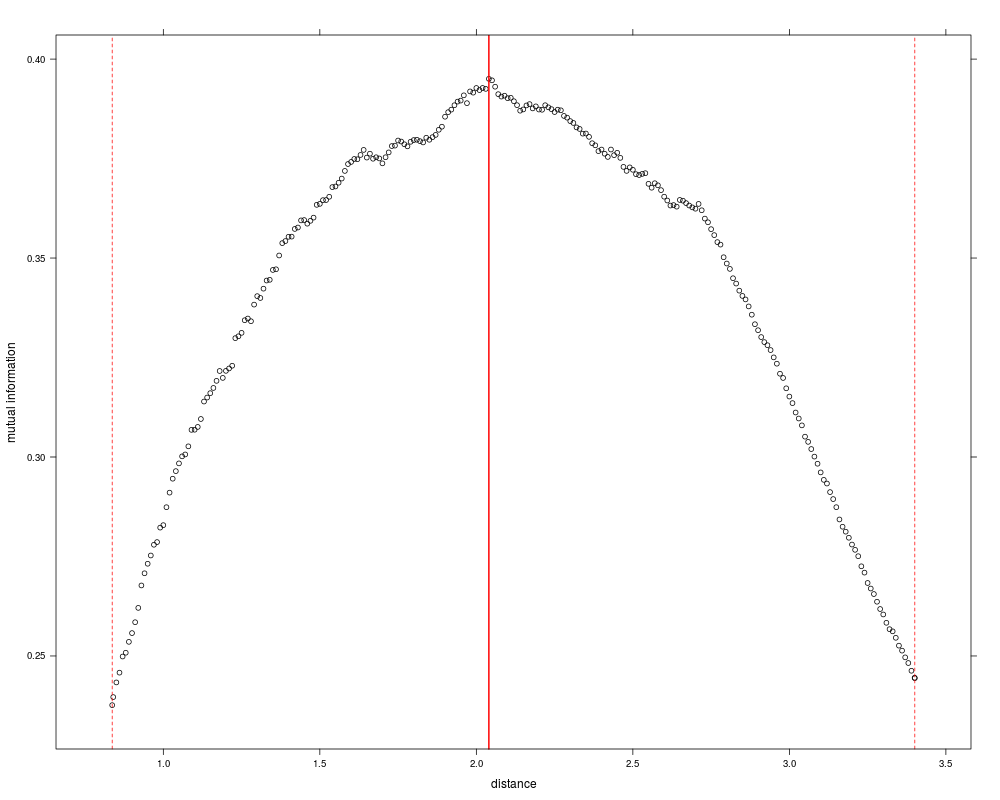
and between-group distances. plotMutinfo produces a plot of
cutpoints vs mutual information scores.
Value
Returns a lattice grid object.
Author(s)
Noah Hoffman
See Also
findThreshold
Examples
data(iris)
dmat <- as.matrix(dist(iris[,1:4], method="euclidean"))
groups <- iris$Species
thresh <- findThreshold(dmat, groups)
do.call(plotDistances, thresh)
do.call(plotMutinfo, thresh)
Results
R version 3.3.1 (2016-06-21) -- "Bug in Your Hair"
Copyright (C) 2016 The R Foundation for Statistical Computing
Platform: x86_64-pc-linux-gnu (64-bit)

R is free software and comes with ABSOLUTELY NO WARRANTY.
You are welcome to redistribute it under certain conditions.
Type 'license()' or 'licence()' for distribution details.

R is a collaborative project with many contributors.
Type 'contributors()' for more information and
'citation()' on how to cite R or R packages in publications.

Type 'demo()' for some demos, 'help()' for on-line help, or
'help.start()' for an HTML browser interface to help.
Type 'q()' to quit R.

> library(clst)
> png(filename="/home/ddbj/snapshot/RGM3/R_BC/result/clst/plotDistances.Rd_%03d_medium.png", width=480, height=480)
> ### Name: plotDistances
> ### Title: Visualize results of 'link{findThreshold}'
> ### Aliases: plotDistances plotMutinfo
> ### Keywords: classif
>
> ### ** Examples
>
> data(iris)
> dmat <- as.matrix(dist(iris[,1:4], method="euclidean"))
> groups <- iris$Species
> thresh <- findThreshold(dmat, groups)
> do.call(plotDistances, thresh)
> do.call(plotMutinfo, thresh)
>
>
>
>
>
> dev.off()
null device
          1
>
|