Supported by Dr. Osamu Ogasawara and  . . |
|
Last data update: 2014.03.03 |
Annotated multidimensional scaling plots.Description Produces annotated representations of two-dimensional
multidimensional scaling plots using Usage
scaleDistPlot(dmat, groups, fill, X, O, indices = "no",
              include, display, labels,
              shuffleGlyphs = NA, key = "top",
              keyCols = 4, glyphs,
              xflip = FALSE, yflip = FALSE, ...)
Arguments
ValueReturns a lattice grid object. Author(s)Noah Hoffman See Also
Examples
data(iris)
dmat <- as.matrix(dist(iris[,1:4], method="euclidean"))
groups <- iris$Species
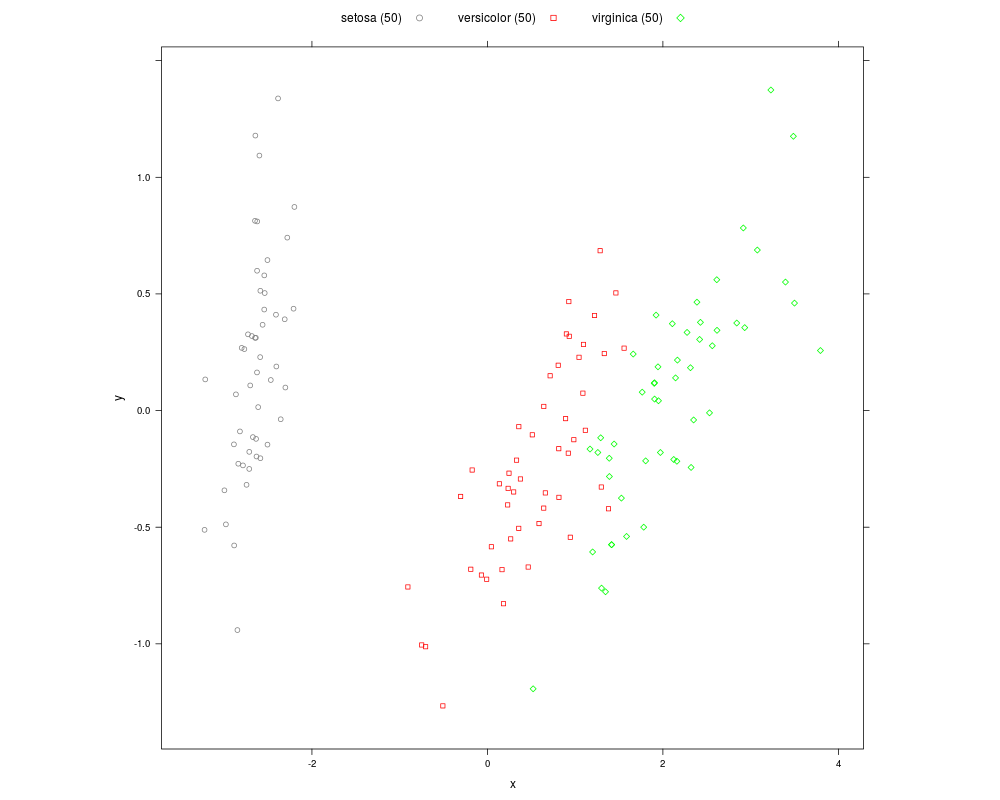
## visualize pairwise euclidean dstances among items in the Iris data set
fig <- scaleDistPlot(dmat, groups)
plot(fig)
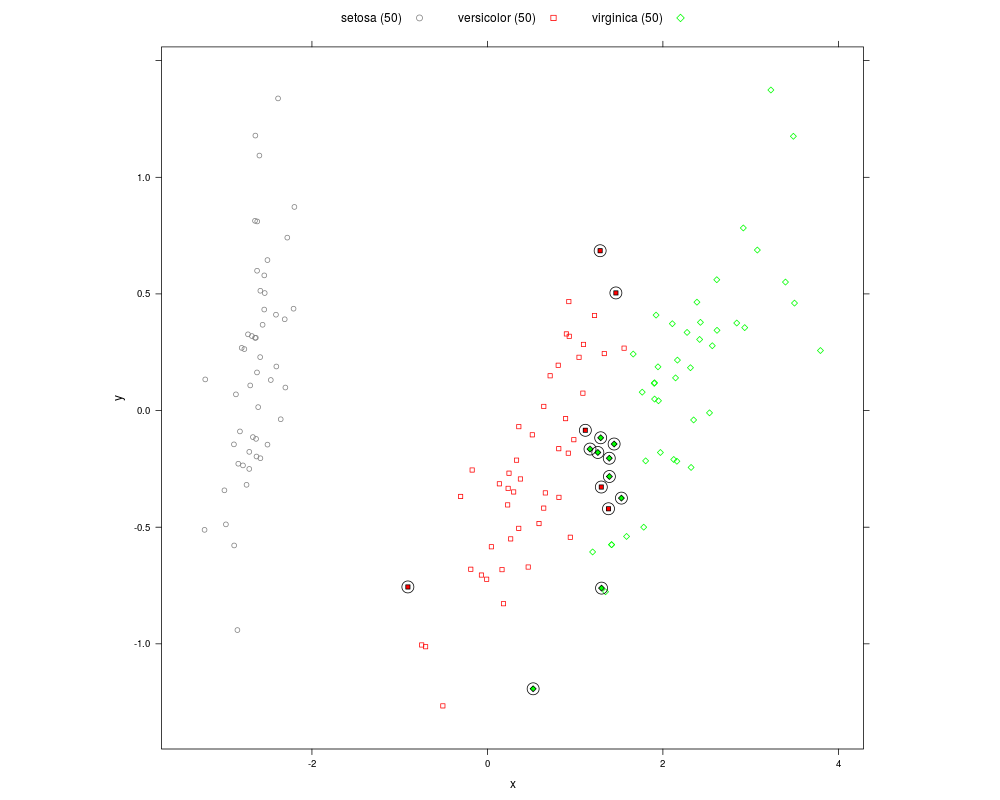
## leave-one-out analysis of the classifier
loo <- lapply(seq_along(groups), function(i){
do.call(classify, pull(dmat, groups, i))
})
matches <- lapply(loo, function(x) rev(x)[[1]]$matches)
result <- sapply(matches, paste, collapse='-')
confusion <- sapply(matches, length) > 1
no_match <- sapply(matches, length) < 1
plot(scaleDistPlot(dmat, groups, fill=confusion, O=confusion, X=no_match))
Results
R version 3.3.1 (2016-06-21) -- "Bug in Your Hair"
Copyright (C) 2016 The R Foundation for Statistical Computing
Platform: x86_64-pc-linux-gnu (64-bit)

R is free software and comes with ABSOLUTELY NO WARRANTY.
You are welcome to redistribute it under certain conditions.
Type 'license()' or 'licence()' for distribution details.

R is a collaborative project with many contributors.
Type 'contributors()' for more information and
'citation()' on how to cite R or R packages in publications.

Type 'demo()' for some demos, 'help()' for on-line help, or
'help.start()' for an HTML browser interface to help.
Type 'q()' to quit R.

> library(clst)
> png(filename="/home/ddbj/snapshot/RGM3/R_BC/result/clst/scaleDistPlot.Rd_%03d_medium.png", width=480, height=480)
> ### Name: scaleDistPlot
> ### Title: Annotated multidimensional scaling plots.
> ### Aliases: scaleDistPlot
> ### Keywords: ~kwd1
>
> ### ** Examples
>
> data(iris)
> dmat <- as.matrix(dist(iris[,1:4], method="euclidean"))
> groups <- iris$Species
>
> ## visualize pairwise euclidean dstances among items in the Iris data set
> fig <- scaleDistPlot(dmat, groups)
> plot(fig)
>
> ## leave-one-out analysis of the classifier
> loo <- lapply(seq_along(groups), function(i){
+   do.call(classify, pull(dmat, groups, i))
+ })
> matches <- lapply(loo, function(x) rev(x)[[1]]$matches)
> result <- sapply(matches, paste, collapse='-')
> confusion <- sapply(matches, length) > 1
> no_match <- sapply(matches, length) < 1
> plot(scaleDistPlot(dmat, groups, fill=confusion, O=confusion, X=no_match))
>
>
>
>
>
> dev.off()
null device
          1
>
|