Supported by Dr. Osamu Ogasawara and  . . |
|
Last data update: 2014.03.03 |
Comparison of a hierarchical and a flat clusteringsDescription
Usage
flatVShier(tree, flat.clustering, flat.order = NULL, max.branches = 100,
    look.ahead = 2, pausing = TRUE, verbose = TRUE, h.min = 0.04, line.wd = 3,
    greedy = TRUE, greedy.colours = NULL, score.function = "crossing",
    expanded = FALSE, labels = NULL, cex.labels = 1, main = NULL)
Arguments
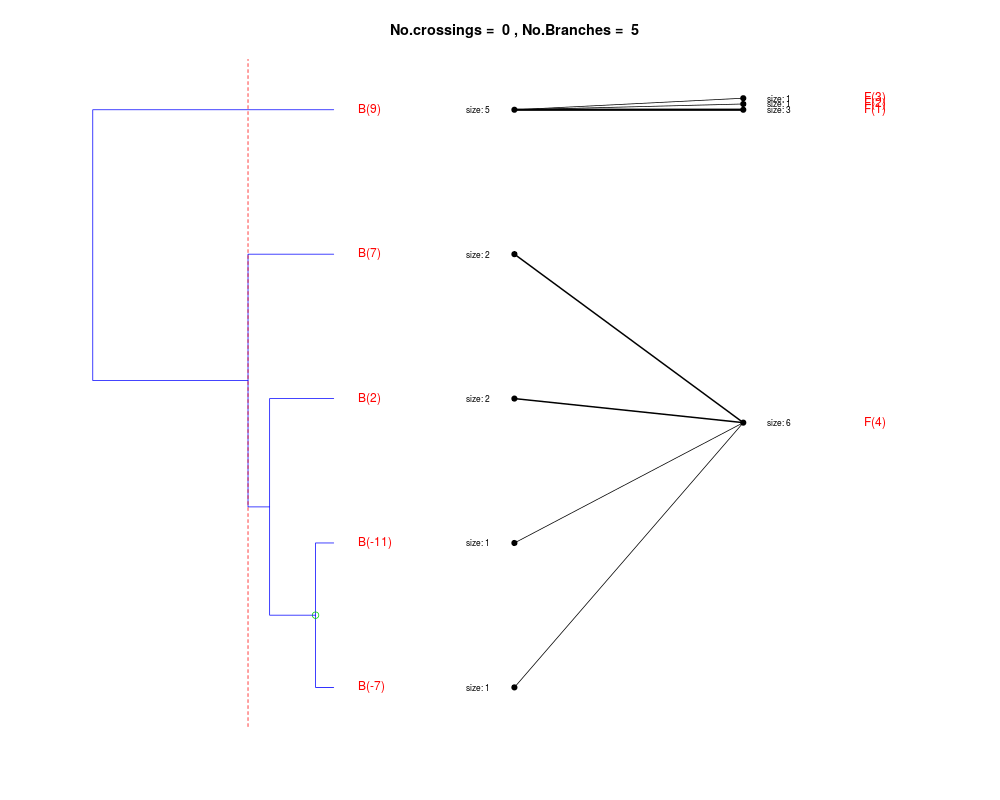
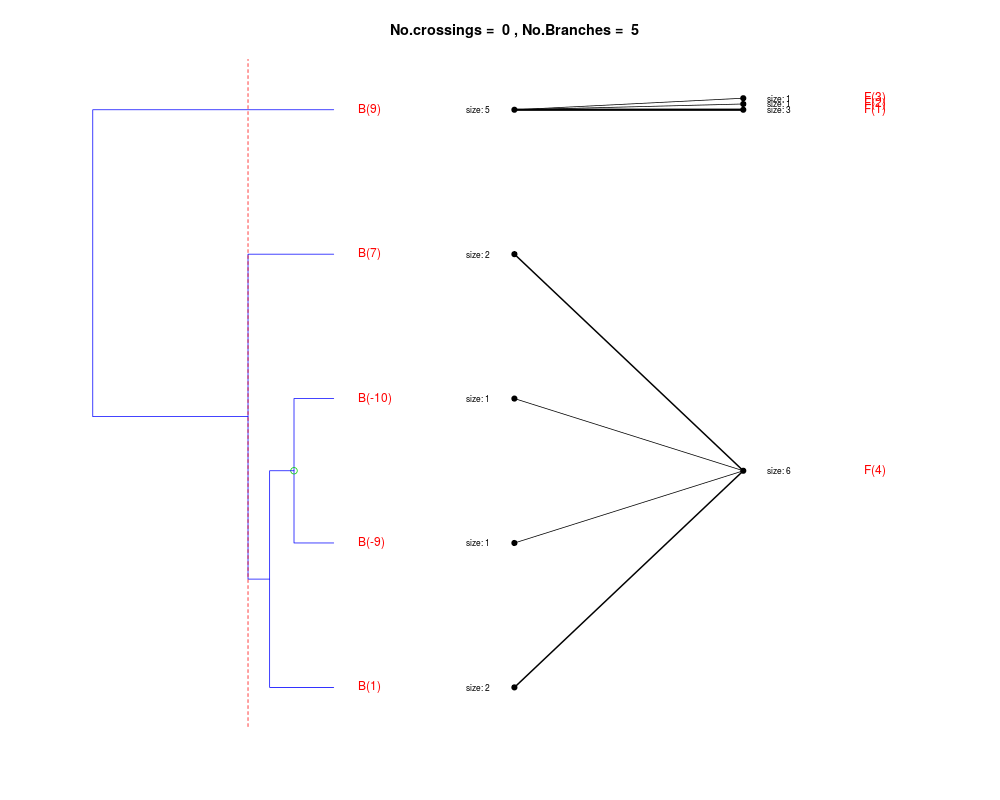
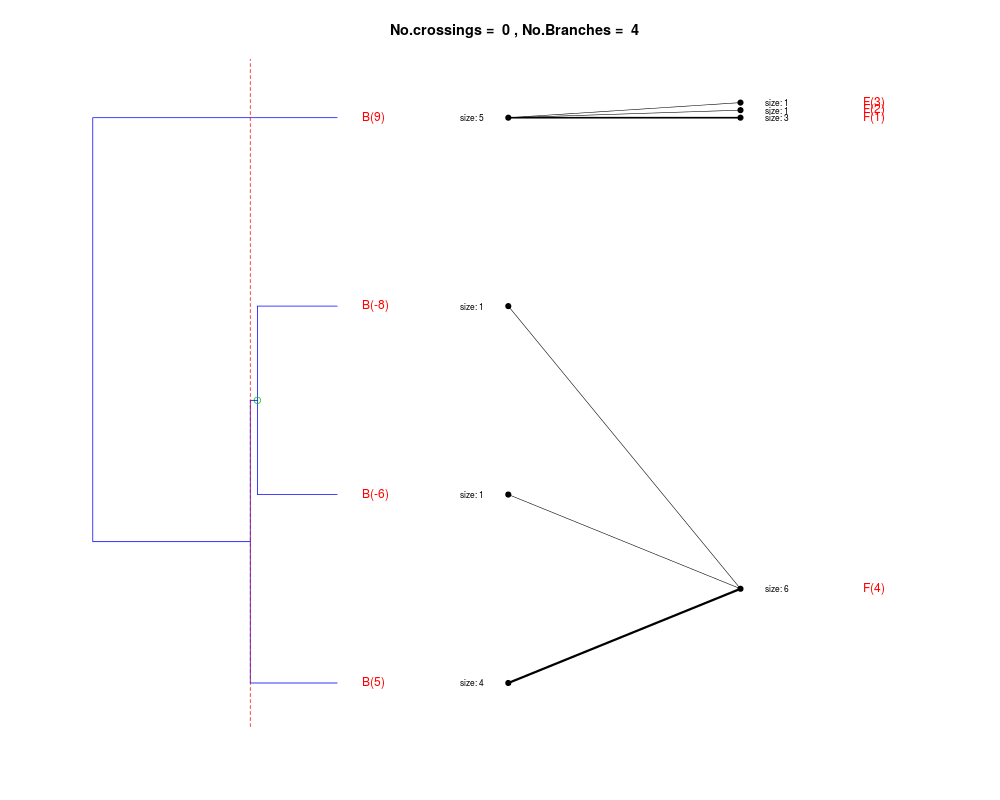
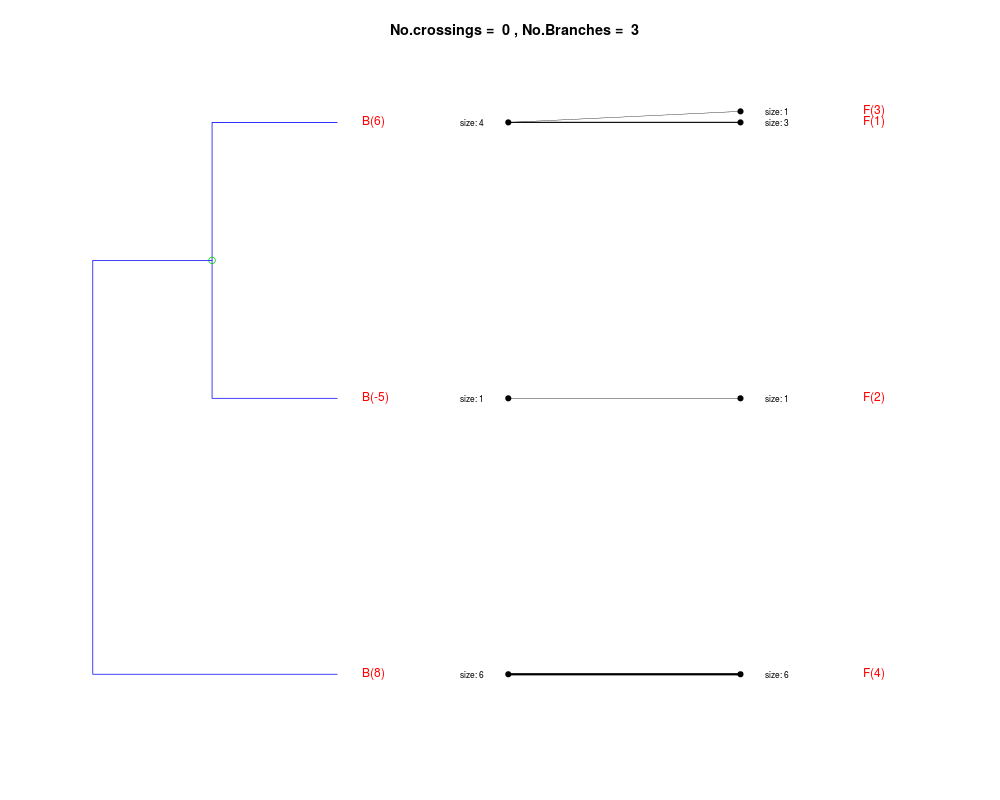
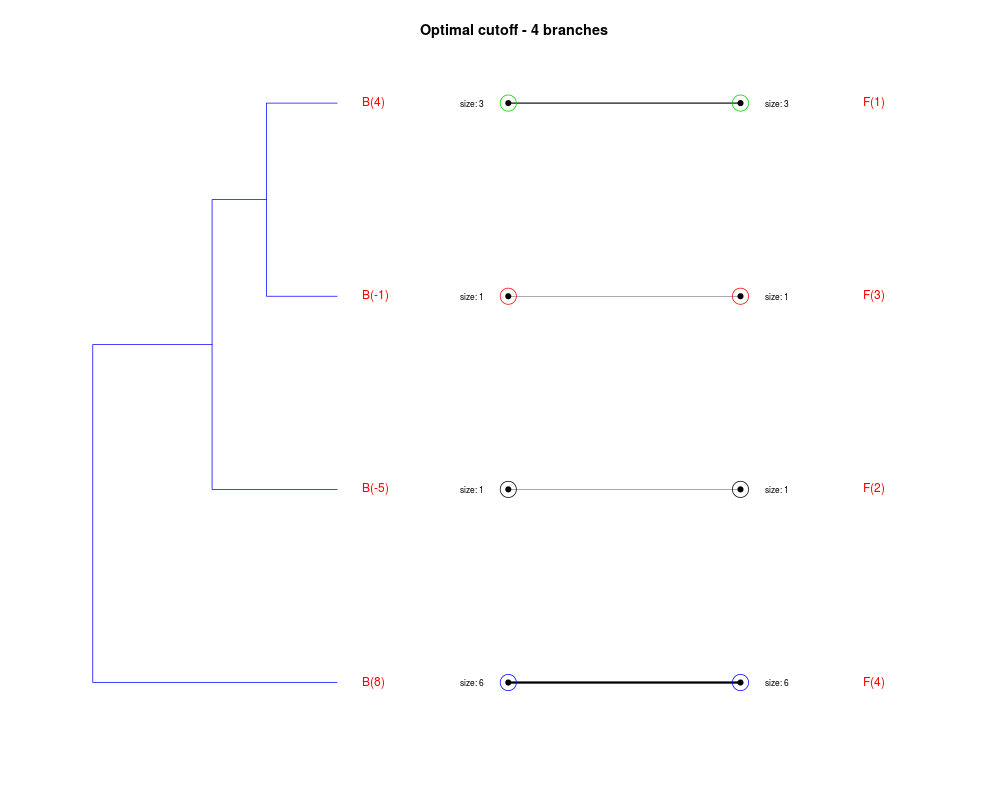
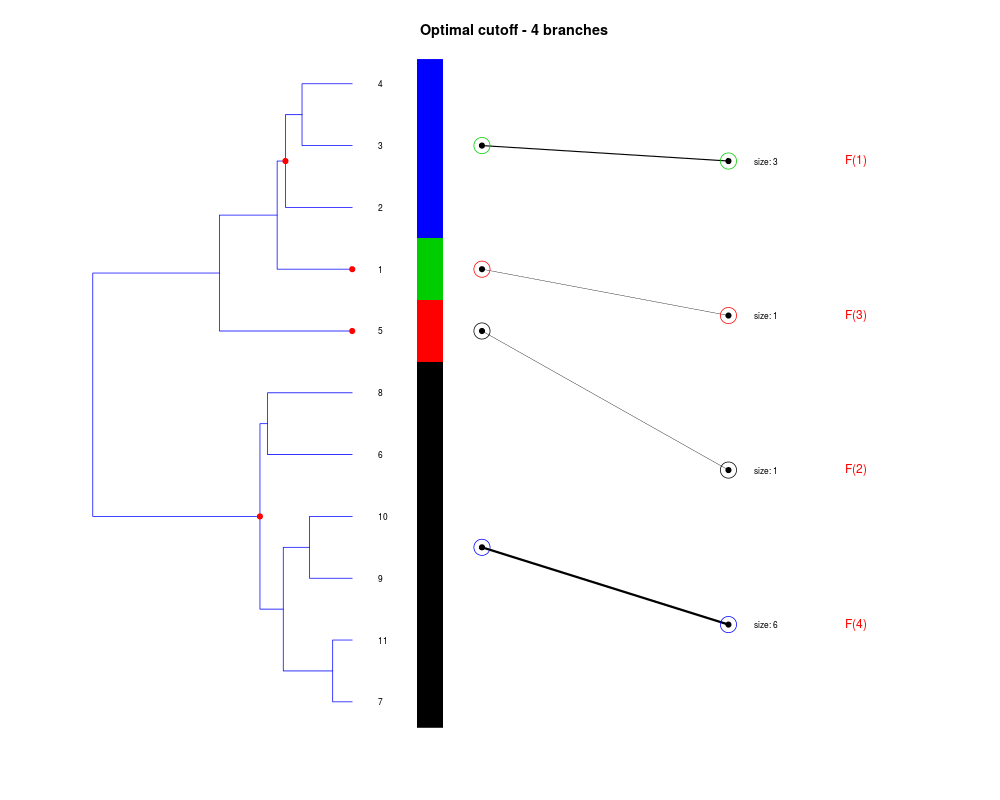
DetailsThe method cuts different branches of the tree at 'optimal' levels, which may be different at different branches, to find the best matches with the flat clustering. The method explores the tree depth-first, starting from the root. In each iteration the goal is to decide whether the branch under consideration (the parent node) is to be split. To that end, the user selects a scoring function based on the bi-graph aesthetics ('crossing') or an alternative based on mutual information between the flat and hierarchical clusterings ('it'). The selected score is first computed for the parent-node. Next it is replaced by its children; the barycentre algorithm, with the swapping strategy, is used on the flat side of the bi- graph. Later, the children in the tree are swapped and the positions on the flat side are likewise updated. The best score obtained by any of these layouts in the children tree is compared to the score of the parent-tree, sp. If it is better, then the splitting is allowed and the tree is subsequently explored. Otherwise, the splitting is discarded, unless it is allowed to look ahead. In that case, the score for the tree with one of the children of the parent-node replaced by its own children is compared to sp; this is repeated until we get a better score for the children or until the maximum number of looking-ahead steps is reached. After the optimal cut-offs are found, it is possible to run a greedy algorithm to determine sets of clusters from each side which have a large overlap. These sets, referred to as superclusters, determine the mapping between the two clusterings. Valuea list of components including:
Author(s)Aurora Torrente aurora@ebi.ac.uk and Alvis Brazma brazma@ebi.ac.uk ReferencesTorrente, A. et al. (2005). A new algorithm for comparing and visualizing relationships between hierarchical and flat gene expression data clusterings. Bioinformatics, 21 (21), 3993-3999. See AlsoflatVSflat, barycentre, score.crossing, score.it, SCmapping Examples
    # simulated data
    set.seed(0)
    dataset <- rbind(matrix(rnorm(20), 5, 4), sweep(matrix(rnorm(24), 6, 4),
        2, 1:4, "+"))
    tree <- hclust(dist(dataset))
    # two clusters
    flat <- kmeans(dataset,2)$cluster
    collapsed1 <- flatVShier(tree, flat, pausing = FALSE)
    # four clusters
    flat<-kmeans(dataset, 4)$cluster
    collapsed2 <- flatVShier(tree, flat)

    ## expanded tree
    expanded1 <- flatVShier(tree, flat, pausing = FALSE, score.function = "it",
        expanded = TRUE)
Results
R version 3.3.1 (2016-06-21) -- "Bug in Your Hair"
Copyright (C) 2016 The R Foundation for Statistical Computing
Platform: x86_64-pc-linux-gnu (64-bit)
R is free software and comes with ABSOLUTELY NO WARRANTY.
You are welcome to redistribute it under certain conditions.
Type 'license()' or 'licence()' for distribution details.
R is a collaborative project with many contributors.
Type 'contributors()' for more information and
'citation()' on how to cite R or R packages in publications.
Type 'demo()' for some demos, 'help()' for on-line help, or
'help.start()' for an HTML browser interface to help.
Type 'q()' to quit R.
> library(clustComp)
> png(filename="/home/ddbj/snapshot/RGM3/R_BC/result/clustComp/flatVShier.Rd_%03d_medium.png", width=480, height=480)
> ### Name: flatVShier
> ### Title: Comparison of a hierarchical and a flat clusterings
> ### Aliases: flatVShier
> ### Keywords: clustering comparison
>
> ### ** Examples
>
> # simulated data
> set.seed(0)
> dataset <- rbind(matrix(rnorm(20), 5, 4), sweep(matrix(rnorm(24), 6, 4),
+ 2, 1:4, "+"))
> tree <- hclust(dist(dataset))
> # two clusters
> flat <- kmeans(dataset,2)$cluster
> collapsed1 <- flatVShier(tree, flat, pausing = FALSE)
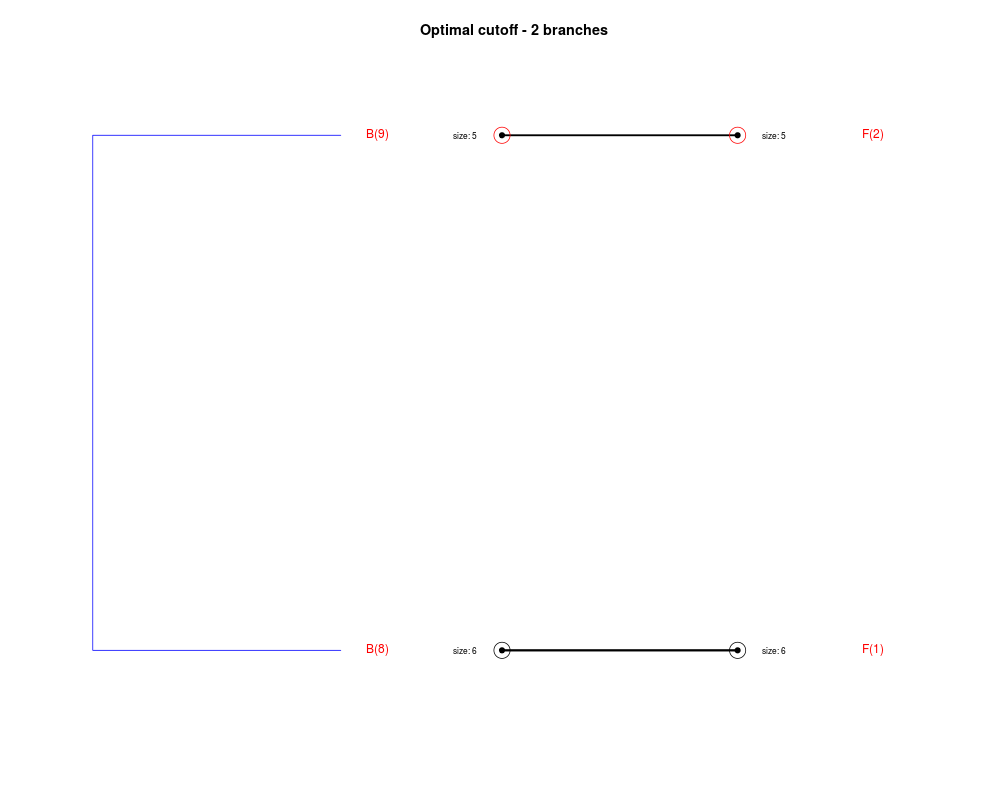
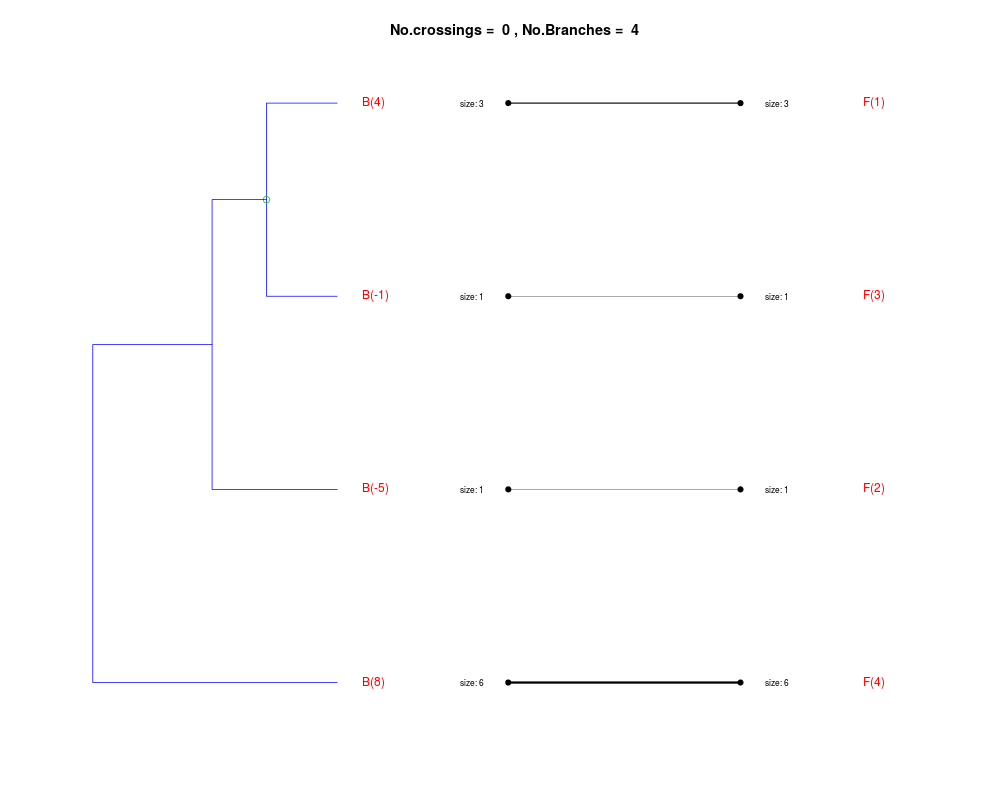
Splitting the branch 10 in sub-branches 8 and 9 improves the score...
Splitting the branch 8 does not improve the score...
We look ahead one more step...
Splitting the branch 5 does not improve the score...
We look ahead one more step...
Splitting the branch 1 does not improve the score...
Can't explore this descendant any further.
Splitting the branch 2 does not improve the score...
Can't explore this descendant any further.
Splitting the branch 7 does not improve the score...
We look ahead one more step...
No splits allowed.
Splitting the branch 9 does not improve the score...
We look ahead one more step...
Splitting the branch 6 does not improve the score...
We look ahead one more step...
Splitting the branch 4 does not improve the score...
Can't explore this descendant any further.
No more splits are allowed.
> # four clusters
> flat<-kmeans(dataset, 4)$cluster
> collapsed2 <- flatVShier(tree, flat)
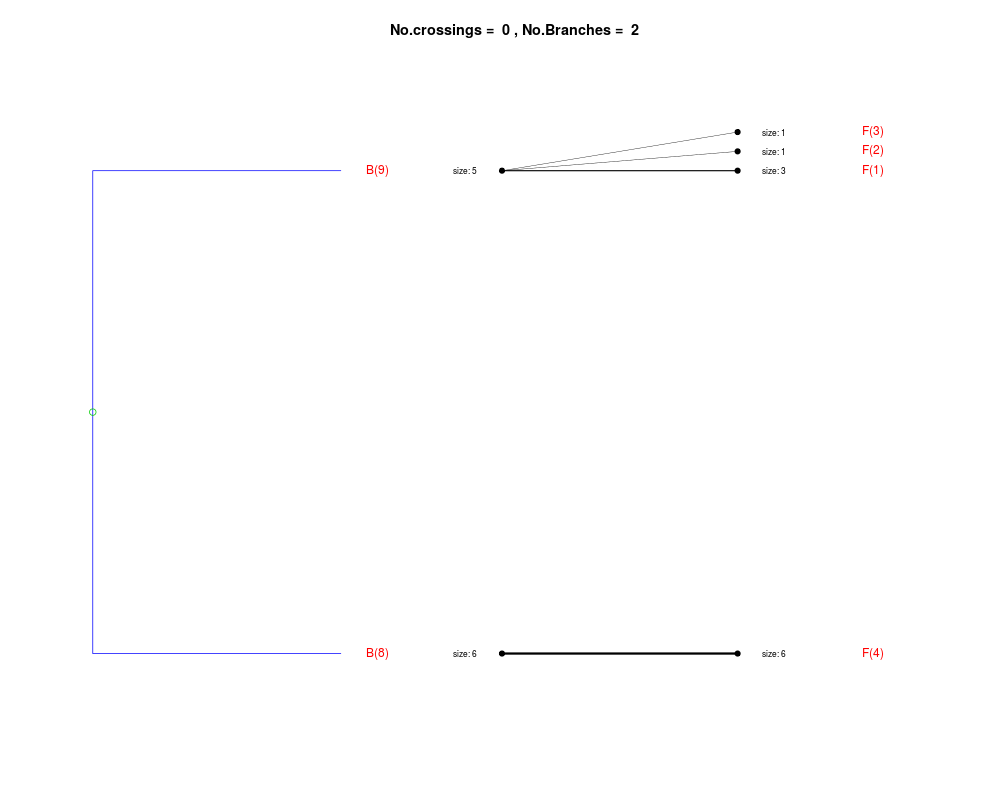
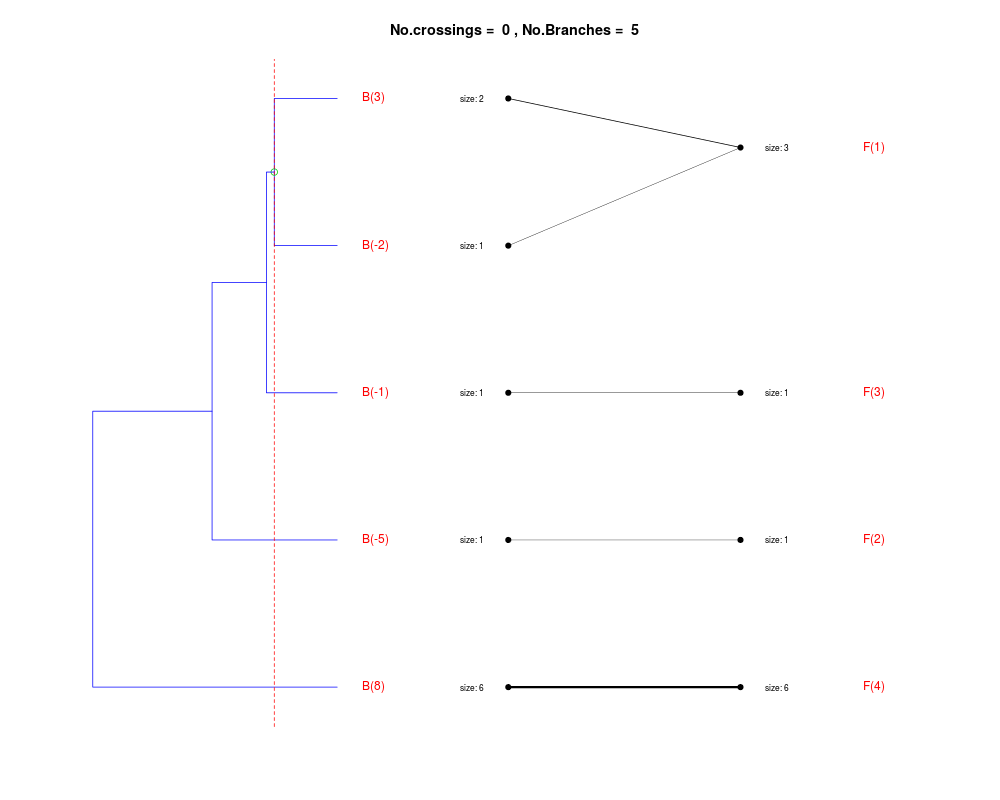
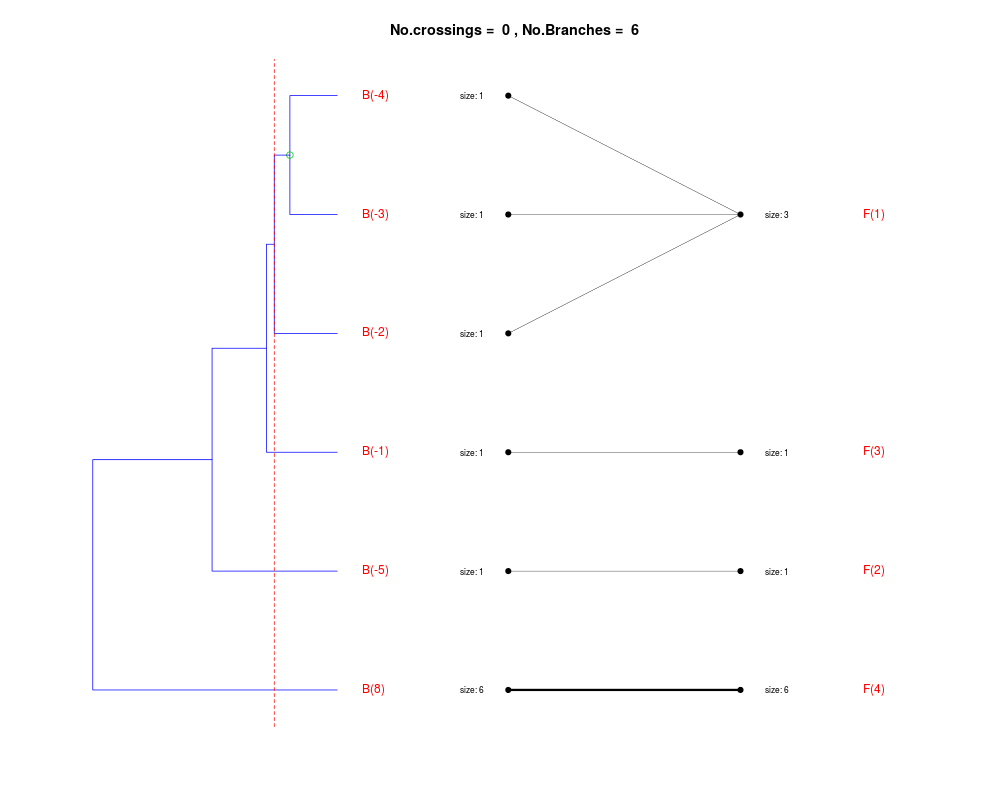
Splitting the branch 10 in sub-branches 8 and 9 improves the score...
Splitting the branch 8 does not improve the score...
We look ahead one more step...
Splitting the branch 5 does not improve the score...
We look ahead one more step...
Splitting the branch 1 does not improve the score...
Can't explore this descendant any further.
Splitting the branch 2 does not improve the score...
Can't explore this descendant any further.
Splitting the branch 7 does not improve the score...
We look ahead one more step...
No splits allowed.
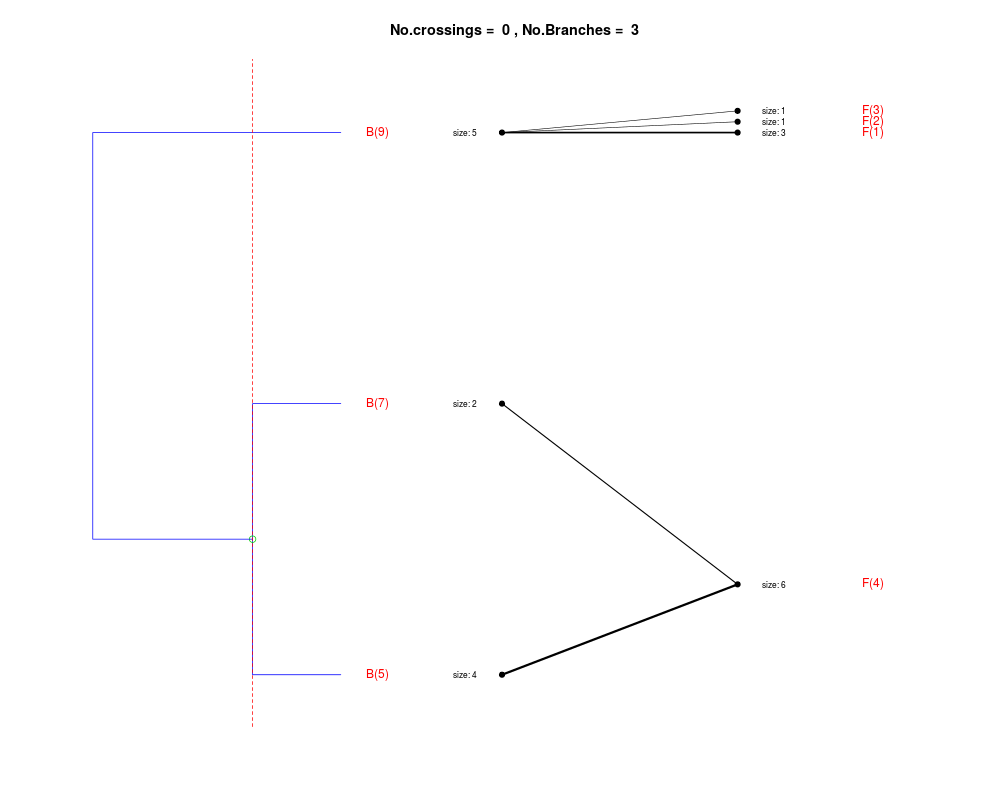
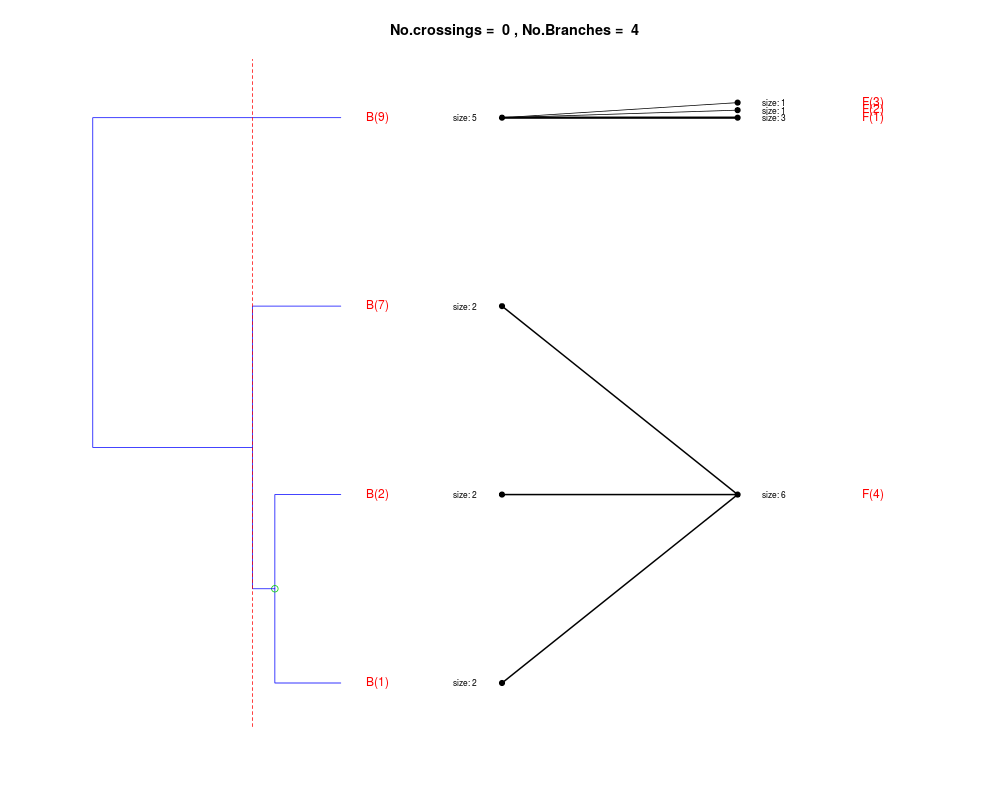
Splitting the branch 9 in sub-branches -5 and 6 improves the score...
Splitting the branch 6 in sub-branches -1 and 4 improves the score...
Splitting the branch 4 does not improve the score...
We look ahead one more step...
Splitting the branch 3 does not improve the score...
We look ahead one more step...
No splits allowed.
>
> ## expanded tree
> expanded1 <- flatVShier(tree, flat, pausing = FALSE, score.function = "it",
+ expanded = TRUE)
Splitting the branch 10 in sub-branches 8 and 9 improves the score...
Splitting the branch 8 does not improve the score...
We look ahead one more step...
Splitting the branch 5 does not improve the score...
We look ahead one more step...
Splitting the branch 1 does not improve the score...
Can't explore this descendant any further.
Splitting the branch 2 does not improve the score...
Can't explore this descendant any further.
Splitting the branch 7 does not improve the score...
We look ahead one more step...
No splits allowed.
Splitting the branch 9 in sub-branches -5 and 6 improves the score...
Splitting the branch 6 in sub-branches -1 and 4 improves the score...
Splitting the branch 4 does not improve the score...
We look ahead one more step...
Splitting the branch 3 does not improve the score...
We look ahead one more step...
No splits allowed.
>
>
>
>
>
> dev.off()
null device
1
>
|