Supported by Dr. Osamu Ogasawara and  . . |
|
Last data update: 2014.03.03 |
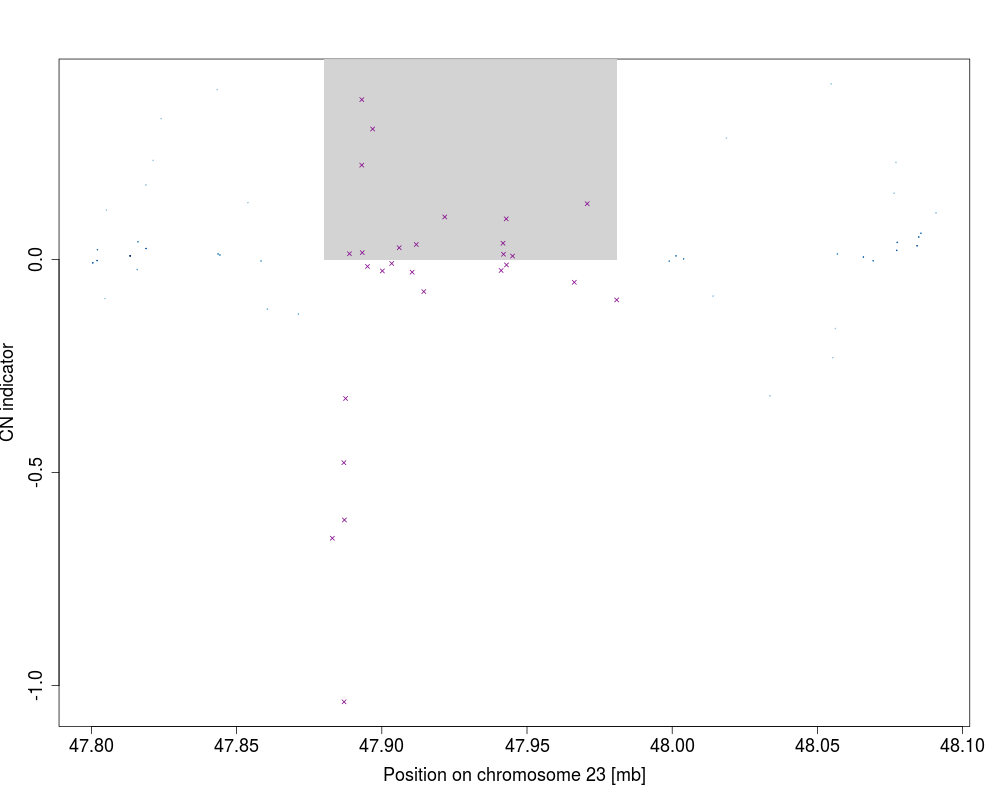
Creates a plot with known regions and a numeric vectorDescriptionCreates a plot with known regions and a numeric vector UsageplotEvalIc(object, segments, chrom, variable, ylim, ylab = "CN indicator", stripCol = "lightgray", regionCol = rgb(130, 0, 139, maxColorValue = 255), pointSize = 0.75, pointType = 4, bandwidth = c(0.01, 1000), nbin = 100) Arguments
ValueSome data Author(s)Andreas Mitterecker Examples
load(system.file("exampleData/slData.RData", package = "cn.farms"))
load(system.file("exampleData/testSegments.RData", package = "cn.farms"))
plotEvalIc(slData, fData(testSegments),
     variable = assayData(slData)$L_z[, 1], 23)
Results
R version 3.3.1 (2016-06-21) -- "Bug in Your Hair"
Copyright (C) 2016 The R Foundation for Statistical Computing
Platform: x86_64-pc-linux-gnu (64-bit)

R is free software and comes with ABSOLUTELY NO WARRANTY.
You are welcome to redistribute it under certain conditions.
Type 'license()' or 'licence()' for distribution details.

R is a collaborative project with many contributors.
Type 'contributors()' for more information and
'citation()' on how to cite R or R packages in publications.

Type 'demo()' for some demos, 'help()' for on-line help, or
'help.start()' for an HTML browser interface to help.
Type 'q()' to quit R.

> library(cn.farms)
Loading required package: Biobase
Loading required package: BiocGenerics
Loading required package: parallel

Attaching package: 'BiocGenerics'

The following objects are masked from 'package:parallel':

    clusterApply, clusterApplyLB, clusterCall, clusterEvalQ,
    clusterExport, clusterMap, parApply, parCapply, parLapply,
    parLapplyLB, parRapply, parSapply, parSapplyLB

The following objects are masked from 'package:stats':

    IQR, mad, xtabs

The following objects are masked from 'package:base':

    Filter, Find, Map, Position, Reduce, anyDuplicated, append,
    as.data.frame, cbind, colnames, do.call, duplicated, eval, evalq,
    get, grep, grepl, intersect, is.unsorted, lapply, lengths, mapply,
    match, mget, order, paste, pmax, pmax.int, pmin, pmin.int, rank,
    rbind, rownames, sapply, setdiff, sort, table, tapply, union,
    unique, unsplit

Welcome to Bioconductor

    Vignettes contain introductory material; view with
    'browseVignettes()'. To cite Bioconductor, see
    'citation("Biobase")', and for packages 'citation("pkgname")'.

Loading required package: ff
Loading required package: bit
Attaching package bit
package:bit (c) 2008-2012 Jens Oehlschlaegel (GPL-2)
creators: bit bitwhich
coercion: as.logical as.integer as.bit as.bitwhich which
operator: ! & | xor != ==
querying: print length any all min max range sum summary
bit access: length<- [ [<- [[ [[<-
for more help type ?bit

Attaching package: 'bit'

The following object is masked from 'package:base':

    xor

Attaching package ff
- getOption("fftempdir")=="/tmp/RtmpuSIi64"

- getOption("ffextension")=="ff"

- getOption("ffdrop")==TRUE

- getOption("fffinonexit")==TRUE

- getOption("ffpagesize")==65536

- getOption("ffcaching")=="mmnoflush"  -- consider "ffeachflush" if your system stalls on large writes

- getOption("ffbatchbytes")==16777216 -- consider a different value for tuning your system

- getOption("ffmaxbytes")==536870912 -- consider a different value for tuning your system


Attaching package: 'ff'

The following objects are masked from 'package:bit':

    clone, clone.default, clone.list

The following objects are masked from 'package:utils':

    write.csv, write.csv2

The following objects are masked from 'package:base':

    is.factor, is.ordered

Loading required package: oligoClasses
Welcome to oligoClasses version 1.34.0
Loading required package: snow

Attaching package: 'snow'

The following objects are masked from 'package:BiocGenerics':

    clusterApply, clusterApplyLB, clusterCall, clusterEvalQ,
    clusterExport, clusterMap, clusterSplit, parApply, parCapply,
    parLapply, parRapply, parSapply

The following objects are masked from 'package:parallel':

    clusterApply, clusterApplyLB, clusterCall, clusterEvalQ,
    clusterExport, clusterMap, clusterSplit, makeCluster, parApply,
    parCapply, parLapply, parRapply, parSapply, splitIndices,
    stopCluster

               _
              | |
 __   _  _    | |  __,   ,_    _  _  _    ,
/    / |/ |   |/  /  |  /  |  / |/ |/ |  / _
___/  |  |_/o|__/_/|_/   |_/  |  |  |_/ /
              |
              |/
Citation: D.-A. Clevert et al.,
cn.FARMS: a latent variable model to detect copy number variations in microarray data with a low false discovery rate
Nucleic Acids Research, 2011.
BibTex: enter 'toBibtex(citation("cn.farms"))'

Homepage: http://www.bioinf.jku.at/software/cnfarms/cnfarms.html

cn.farms Package Version 1.20.0
cn.farms v1.20.0 (2014-05-19) successfully loaded.
> png(filename="/home/ddbj/snapshot/RGM3/R_BC/result/cn.farms/plotEvalIc.Rd_%03d_medium.png", width=480, height=480)
> ### Name: plotEvalIc
> ### Title: Creates a plot with known regions and a numeric vector
> ### Aliases: plotEvalIc
>
> ### ** Examples
>
> load(system.file("exampleData/slData.RData", package = "cn.farms"))
> load(system.file("exampleData/testSegments.RData", package = "cn.farms"))
> plotEvalIc(slData, fData(testSegments),
+      variable = assayData(slData)$L_z[, 1], 23)
>
>
>
>
>
> dev.off()
null device
          1
>
|
Created & Maintained by Osamu Ogasawara (osamu.ogasawara@gmail.com) and 