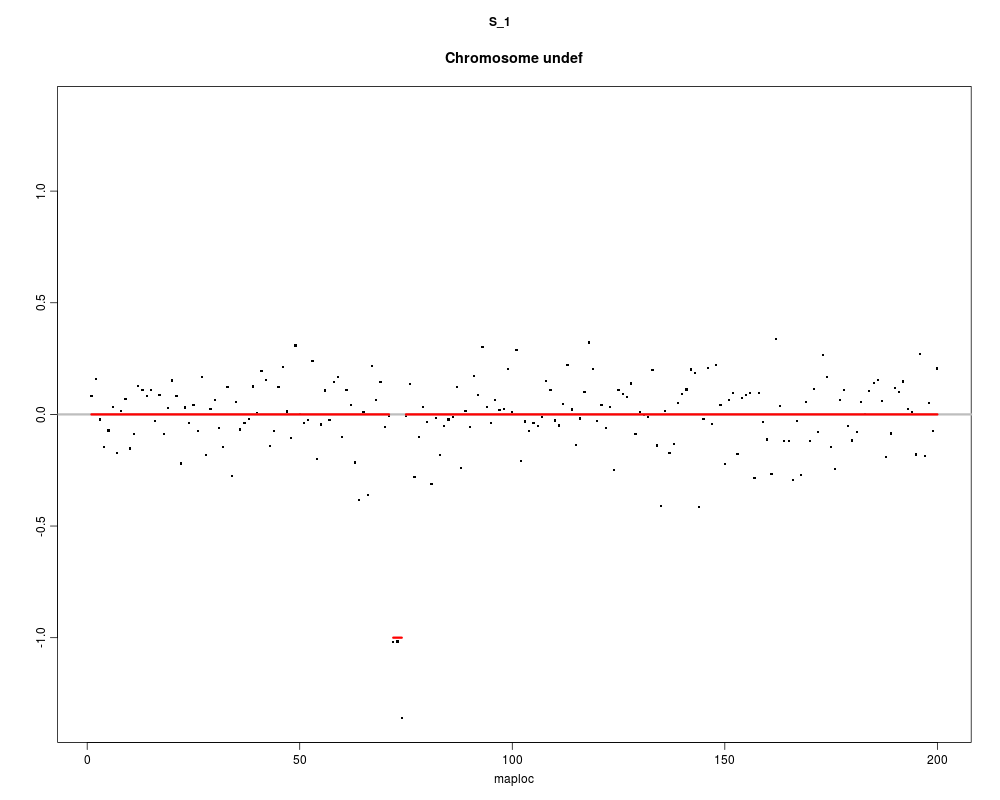
Plots the log normalized read counts and the detected
segments as a segmentation plot.
Arguments
r
An instance of "CNVDetectionResult"
mainCN
The name of the main copy number. That is
"CN2" for diploid individuals. For haplocn.mops this
should be set to "CN1".
sampleIdx
The index of the samples to be plotted.
(Default = missing)
seqnames
The names of the reference sequence
(chromosomes) to be plotted. (Default = missing)
segStat
Whether the segment line should display
the mean or the median of a segments calls. (Default =
"mean").
plot.type
the type of plot. (Default = "s").
altcol
logical flag to indicate if chromosomes
should be plotted in alternating colors in the whole
genome plot. (Default = TRUE).
sbyc.layout
layout settings for the
multifigure grid layout for the ‘samplebychrom’ type. It
should be specified as a vector of two integers which are
the number of rows and columns. The default values are
chosen based on the number of chromosomes to produce a
near square graph. For normal genome it is 4x6 (24
chromosomes) plotted by rows. (Default = NULL).
cbys.layout
layout settings for the
multifigure grid layout for the ‘chrombysample’ type. As
above it should be specified as number of rows and
columns and the default chosen based on the number of
samples. (Default = NULL).
cbys.nchrom
the number of chromosomes per page in
the layout. (Default = 1).
include.means
logical flag to indicate whether
segment means are to be drawn. (Default = TRUE).
zeroline
logical flag to indicate whether a
horizontal line at y=0 is to be drawn. (Default = TRUE).
pt.pch
the plotting character used for plotting
the log-ratio values. (Default = ".")
pt.cex
the size of plotting character used for the
log-ratio values (Default = 3).
pt.cols
the color list for the points. The colors
alternate between chromosomes. (Default =
c("green","black").)
segcol
the color of the lines indicating the
segment means. (Default = "red").
zlcol
the color of the zeroline. (Default =
"grey").
ylim
this argument is present to override the
default limits which is the range of symmetrized
log-ratios. (Default = NULL).
lwd
line weight of lines for segment mean and
zeroline. (Default = 3).
...
other arguments which will be passed to
plot commands.
data(cn.mops)
r <- cn.mops(X[1:200, ])
segplot(r,sampleIdx=1)
Results
R version 3.3.1 (2016-06-21) -- "Bug in Your Hair"
Copyright (C) 2016 The R Foundation for Statistical Computing
Platform: x86_64-pc-linux-gnu (64-bit)

R is free software and comes with ABSOLUTELY NO WARRANTY.
You are welcome to redistribute it under certain conditions.
Type 'license()' or 'licence()' for distribution details.

R is a collaborative project with many contributors.
Type 'contributors()' for more information and
'citation()' on how to cite R or R packages in publications.

Type 'demo()' for some demos, 'help()' for on-line help, or
'help.start()' for an HTML browser interface to help.
Type 'q()' to quit R.

> library(cn.mops)
Loading required package: parallel
Loading required package: GenomicRanges
Loading required package: BiocGenerics

Attaching package: 'BiocGenerics'

The following objects are masked from 'package:parallel':

    clusterApply, clusterApplyLB, clusterCall, clusterEvalQ,
    clusterExport, clusterMap, parApply, parCapply, parLapply,
    parLapplyLB, parRapply, parSapply, parSapplyLB

The following objects are masked from 'package:stats':

    IQR, mad, xtabs

The following objects are masked from 'package:base':

    Filter, Find, Map, Position, Reduce, anyDuplicated, append,
    as.data.frame, cbind, colnames, do.call, duplicated, eval, evalq,
    get, grep, grepl, intersect, is.unsorted, lapply, lengths, mapply,
    match, mget, order, paste, pmax, pmax.int, pmin, pmin.int, rank,
    rbind, rownames, sapply, setdiff, sort, table, tapply, union,
    unique, unsplit

Loading required package: S4Vectors
Loading required package: stats4

Attaching package: 'S4Vectors'

The following objects are masked from 'package:base':

    colMeans, colSums, expand.grid, rowMeans, rowSums

Loading required package: IRanges
Loading required package: GenomeInfoDb

Attaching package: 'cn.mops'

The following object is masked from 'package:S4Vectors':

    params

> png(filename="/home/ddbj/snapshot/RGM3/R_BC/result/cn.mops/segplot.Rd_%03d_medium.png", width=480, height=480)
> ### Name: segplot
> ### Title: Visualization of a CNV detection result.
> ### Aliases: segplot
>
> ### ** Examples
>
> data(cn.mops)
> r <- cn.mops(X[1:200, ])
Normalizing...
Starting local modeling, please be patient...
Reference sequence:  undef
Starting segmentation algorithm...
Using "fastseg" for segmentation.
> segplot(r,sampleIdx=1)
Segplot might not work because of special characters in the sample names. Use only A-Z,a-z and 0-9!
 There is a hidden function cn.mops:::.replaceNames that replaces the names in the "CNVDetectionResult" object.
>
>
>
>
>
> dev.off()
null device
          1
>
 .
.