Supported by Dr. Osamu Ogasawara and  . . |
|
Last data update: 2014.03.03 |
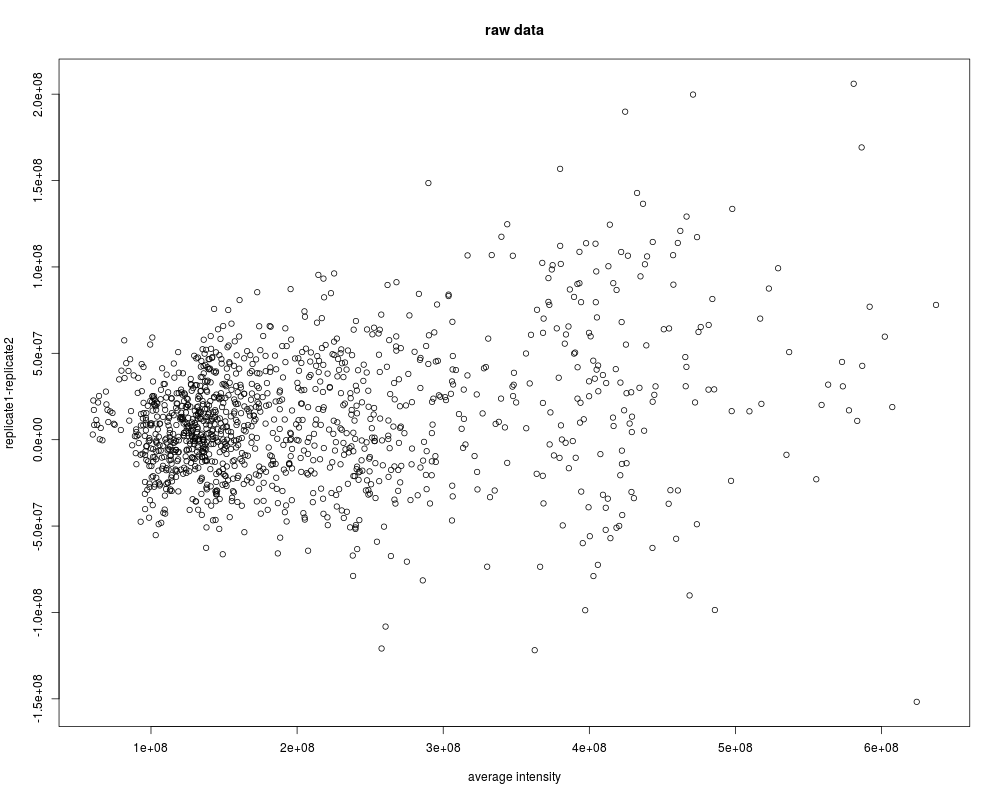
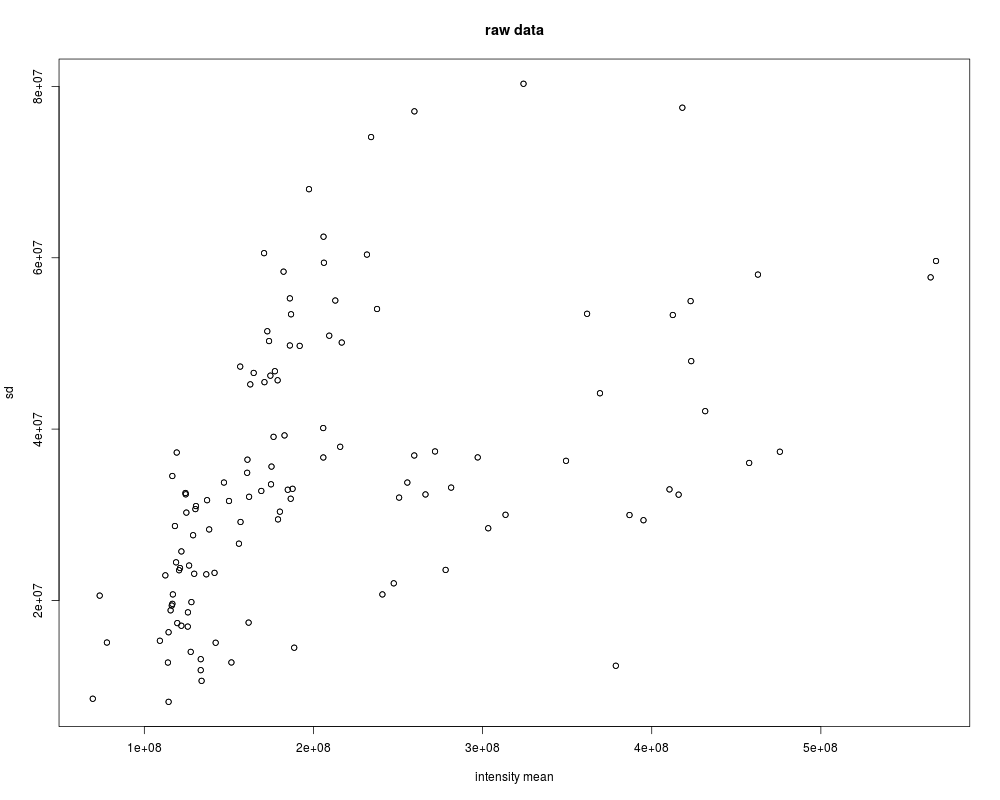
plot variation vs signal intensityDescriptionplots the variation of replicates vs the mean intensity either by within screen replicate separatly or over all screen replicates. UsageSDplot(df, xlab="intensity mean",ylab="sd",add=FALSE,main,...) MAplot(df, main,rank=FALSE) Arguments
Valueplot Author(s)Elin Axelsson See Also
Examplesdata(screen1_raw) df=cellHTS2df(screen1_raw,neutral="Fluc") MAplot(df,main="raw data") SDplot(df,main="raw data") Results
R version 3.3.1 (2016-06-21) -- "Bug in Your Hair"
Copyright (C) 2016 The R Foundation for Statistical Computing
Platform: x86_64-pc-linux-gnu (64-bit)

R is free software and comes with ABSOLUTELY NO WARRANTY.
You are welcome to redistribute it under certain conditions.
Type 'license()' or 'licence()' for distribution details.

R is a collaborative project with many contributors.
Type 'contributors()' for more information and
'citation()' on how to cite R or R packages in publications.

Type 'demo()' for some demos, 'help()' for on-line help, or
'help.start()' for an HTML browser interface to help.
Type 'q()' to quit R.

> library(coRNAi)
Loading required package: cellHTS2
Loading required package: RColorBrewer
Loading required package: Biobase
Loading required package: BiocGenerics
Loading required package: parallel

Attaching package: 'BiocGenerics'

The following objects are masked from 'package:parallel':

    clusterApply, clusterApplyLB, clusterCall, clusterEvalQ,
    clusterExport, clusterMap, parApply, parCapply, parLapply,
    parLapplyLB, parRapply, parSapply, parSapplyLB

The following objects are masked from 'package:stats':

    IQR, mad, xtabs

The following objects are masked from 'package:base':

    Filter, Find, Map, Position, Reduce, anyDuplicated, append,
    as.data.frame, cbind, colnames, do.call, duplicated, eval, evalq,
    get, grep, grepl, intersect, is.unsorted, lapply, lengths, mapply,
    match, mget, order, paste, pmax, pmax.int, pmin, pmin.int, rank,
    rbind, rownames, sapply, setdiff, sort, table, tapply, union,
    unique, unsplit

Welcome to Bioconductor

    Vignettes contain introductory material; view with
    'browseVignettes()'. To cite Bioconductor, see
    'citation("Biobase")', and for packages 'citation("pkgname")'.

Loading required package: genefilter
Loading required package: splots
Loading required package: vsn
Loading required package: hwriter
Loading required package: locfit
locfit 1.5-9.1 	 2013-03-22
Loading required package: grid
Loading required package: limma

Attaching package: 'limma'

The following object is masked from 'package:BiocGenerics':

    plotMA

> png(filename="/home/ddbj/snapshot/RGM3/R_BC/result/coRNAi/signalplots.Rd_%03d_medium.png", width=480, height=480)
> ### Name: signalplots
> ### Title: plot variation vs signal intensity
> ### Aliases: signalplots SDplot MAplot
>
> ### ** Examples
>
> data(screen1_raw)
> df=cellHTS2df(screen1_raw,neutral="Fluc")
> MAplot(df,main="raw data")
> SDplot(df,main="raw data")
>
>
>
>
>
> dev.off()
null device
          1
>
|
Created & Maintained by Osamu Ogasawara (osamu.ogasawara@gmail.com) and 