Supported by Dr. Osamu Ogasawara and  . . |
|
Last data update: 2014.03.03 |
Co-expressed gene set enrichment analysisDescriptionTo discovery smaller scale, but highly correlated cellular events that may be of great biological relevance, co-expressed gene set enrichment analysis, cogena, clusters gene expression profiles (coExp) and then make enrichment analysis for each clusters (clEnrich) based on hyper-geometric test. The heatmapCluster and heatmapPEI can visualise the results. See vignette for the detailed workflow. Sourcehttps://github.com/zhilongjia/cogena Examples
## A quick start
# Loading the examplar dataseat
data(Psoriasis)
# Clustering the gene expression profiling
clMethods <- c("hierarchical","kmeans","diana","fanny","som","model","sota","pam","clara","agnes")
genecl_result <- coExp(DEexprs, nClust=5:6, clMethods=clMethods,
metric="correlation", method="complete", ncore=2, verbose=TRUE)
# Gene set used
annofile <- system.file("extdata", "c2.cp.kegg.v5.0.symbols.gmt.xz", package="cogena")
# Enrichment analysis for clusters
clen_res <- clEnrich(genecl_result, annofile=annofile, sampleLabel=sampleLabel)
summary(clen_res)
# Visualisation
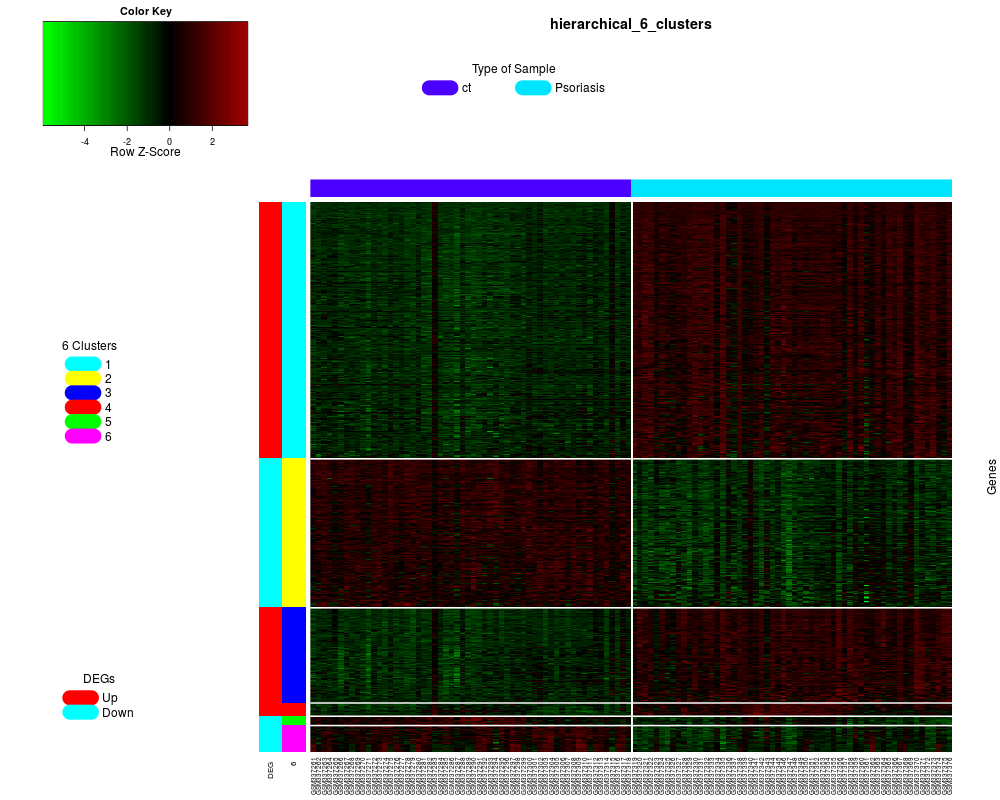
heatmapCluster(clen_res, "hierarchical", "6")
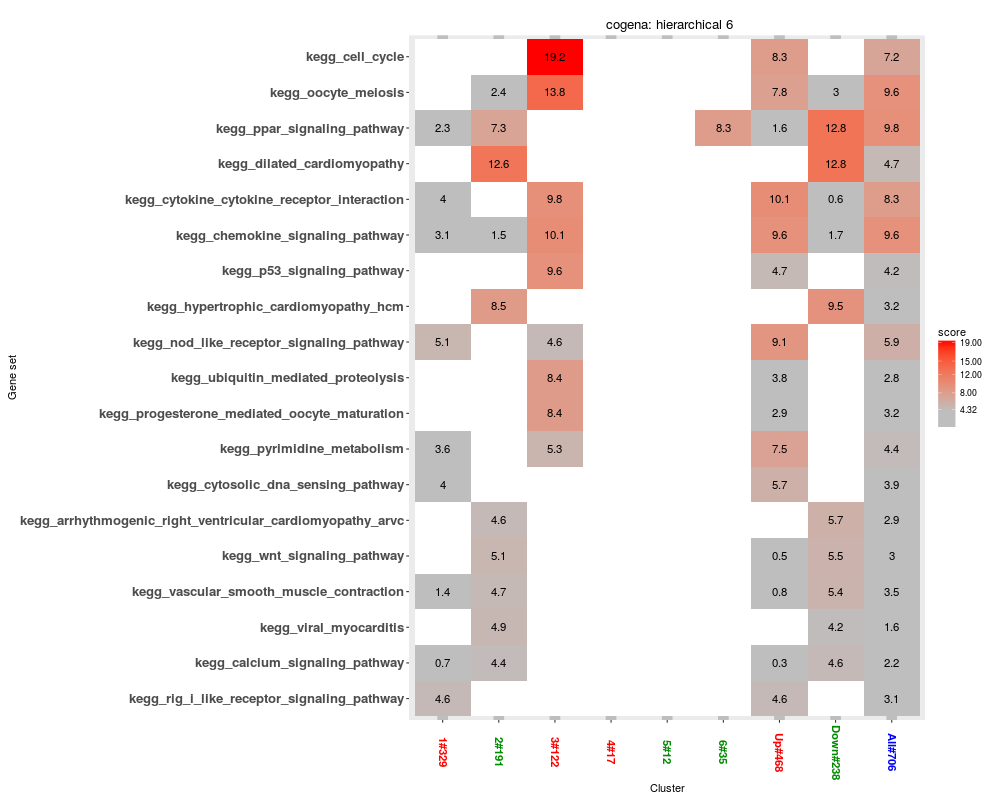
heatmapPEI(clen_res, "hierarchical", "6", printGS=FALSE)
# Obtain genes in a certain cluster
head(geneInCluster(clen_res, "hierarchical", "6", "2"))
## The end
Results
R version 3.3.1 (2016-06-21) -- "Bug in Your Hair"
Copyright (C) 2016 The R Foundation for Statistical Computing
Platform: x86_64-pc-linux-gnu (64-bit)

R is free software and comes with ABSOLUTELY NO WARRANTY.
You are welcome to redistribute it under certain conditions.
Type 'license()' or 'licence()' for distribution details.

R is a collaborative project with many contributors.
Type 'contributors()' for more information and
'citation()' on how to cite R or R packages in publications.

Type 'demo()' for some demos, 'help()' for on-line help, or
'help.start()' for an HTML browser interface to help.
Type 'q()' to quit R.

> library(cogena)
Loading required package: cluster
Loading required package: ggplot2
Loading required package: kohonen
Loading required package: class
Loading required package: MASS
> png(filename="/home/ddbj/snapshot/RGM3/R_BC/result/cogena/cogena_package.Rd_%03d_medium.png", width=480, height=480)
> ### Name: cogena_package
> ### Title: Co-expressed gene set enrichment analysis
> ### Aliases: cogean_package cogena cogena_package cogena_package-package
> ### Keywords: package
>
> ### ** Examples
>
>
> ## A quick start
>
> # Loading the examplar dataseat
> data(Psoriasis)
>
> # Clustering the gene expression profiling
> clMethods <- c("hierarchical","kmeans","diana","fanny","som","model","sota","pam","clara","agnes")
> genecl_result <- coExp(DEexprs, nClust=5:6, clMethods=clMethods,
+     metric="correlation", method="complete", ncore=2, verbose=TRUE)
[1] "Dist caculation done"
[1] "# The clMethod, hierarchical starts #"
[1] "getDoParWorkers: 2"
[1] "The clMethod, hierarchical done"
[1] "# The clMethod, kmeans starts #"
[1] "getDoParWorkers: 2"
[1] "The clMethod, kmeans done"
[1] "# The clMethod, diana starts #"
[1] "getDoParWorkers: 2"
[1] "The clMethod, diana done"
[1] "# The clMethod, fanny starts #"
[1] "getDoParWorkers: 2"
[1] "The clMethod, fanny done"
[1] "# The clMethod, som starts #"
[1] "getDoParWorkers: 2"
[1] "The clMethod, som done"
[1] "# The clMethod, model starts #"
[1] "getDoParWorkers: 2"
[1] "The clMethod, model done"
[1] "# The clMethod, sota starts #"
[1] "getDoParWorkers: 2"
[1] "The clMethod, sota done"
[1] "# The clMethod, pam starts #"
[1] "getDoParWorkers: 2"
[1] "The clMethod, pam done"
[1] "# The clMethod, clara starts #"
[1] "getDoParWorkers: 2"
[1] "The clMethod, clara done"
[1] "# The clMethod, agnes starts #"
[1] "getDoParWorkers: 2"
[1] "The clMethod, agnes done"
>
> # Gene set used
> annofile <- system.file("extdata", "c2.cp.kegg.v5.0.symbols.gmt.xz", package="cogena")
>
> # Enrichment analysis for clusters
> clen_res <- clEnrich(genecl_result, annofile=annofile, sampleLabel=sampleLabel)
>
> summary(clen_res)

Clustering Methods:
 hierarchical kmeans diana fanny som model sota pam clara agnes

The Number of Clusters:
 5 6

Metric of Distance Matrix:
 correlation

Agglomeration method for hierarchical clustering (hclust and agnes):
 complete

Gene set:
 c2.cp.kegg.v5.0.symbols.gmt.xz

>
>
> # Visualisation
> heatmapCluster(clen_res, "hierarchical", "6")
The number of genes in each cluster:
upDownGene
  1   2
468 238
cluster_size
  1   2   3   4   5   6
329 191 122  17  12  35
> heatmapPEI(clen_res, "hierarchical", "6", printGS=FALSE)
>
> # Obtain genes in a certain cluster
> head(geneInCluster(clen_res, "hierarchical", "6", "2"))
[1] "BTC"     "KRT77"   "C5ORF46" "CLDN1"   "PTPN21"  "PLLP"
>
> ## The end
>
>
>
>
>
>
> dev.off()
null device
          1
>
|
Created & Maintained by Osamu Ogasawara (osamu.ogasawara@gmail.com) and 