Supported by Dr. Osamu Ogasawara and  . . |
|
Last data update: 2014.03.03 |
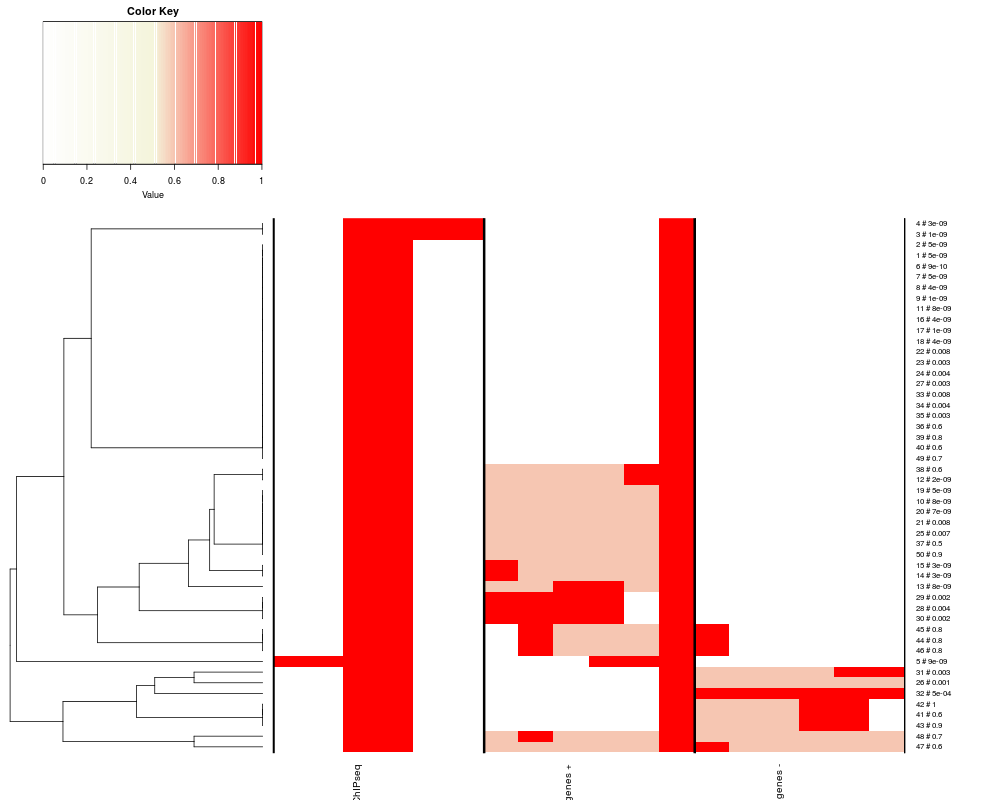
displays the heatmap based on the data from heatmapDataDescriptiondisplays heatmap of counts for a list of GRanges, typically computed based on the heatmapData function UsageheatmapPlot(matList, sigMat=NULL, qnorm=NULL, tnorm=NULL, rowLab=FALSE, colLab=TRUE, margins=NULL, colors=NULL, clusterInds=1:length(matList), dendrogram=TRUE) Arguments
DetailsEach matrix in matList is either ranging from 0 to 1 or will be forced to by dividing to its maxumum. Alternatively, matrix normalization can be obtained using qnorm or tnorm. Setting qrnorm to X [0,1] for a given matList matrix will force the maximum of the matrix to be quantile(matrix, X). Setting trnorm to X for a given matList matrix will force the maximum of the matrix to be X. Using either qnorm or tnorm matrix will be finally normalized to 1 by dividing it by its maximum. If sigMat is not NULL it is expected to contain a list of pvalues or scores [0,1] for each range for each matList dataset. The colorscale of the heatmap will be adjusted to display the significance, by lightening the observation colors as a function of its significance, see the example. A minimum pvalue of 1e-10 is forced. 50 levels of intensity (white to orange to red palette, as displayed in the colorscale) and 10 levels of significance (white for the less significance, full color according to the intensity palette, as displayed in the colorsclae) are considered. Plese ignore the values reported in the colorscale. If sigMat is NULL, the normalized intensity in each matList item is reported as it is on a white to beige to red default palette, or based on the colors defined in the colors argument. If margins is set to NULL the row and columns margins used to display labels are computed automatically, otherwise a numeric array of length two can be set to define them (in lines). clusterInds can be used to define which matList items drive the clustering of heatmap rows. If clusterInds is NULL no clustering is performed and no dendrogram is displayed. If clusterInds is an array of index in 1:length(matList), only those matList items will be used to determine the clustering and the dendrogram, while all matList data will be displayed. If a TxDB was provided to heatmapData beofre calling heatmapPlot, the last two tracks are about the overlap with exons and introns in the forward and reverse strand, repectively. If the default white to red color palette is used, and sigMat is NULL exons will be plotted in red and introns in pink. Rather, if sigMat is defined, introns will be in orange. ValueA list with two items
Be careful that the rowInds contained in heatRes poiting to the new order of clustered data rows, is intended to list the reordered rows starting from the bottom of the heatmap. Referenceshttp://genomics.iit.it/groups/computational-epigenomics.html See AlsoSee Also as Examplesrequire(TxDb.Mmusculus.UCSC.mm9.knownGene) txdb <- TxDb.Mmusculus.UCSC.mm9.knownGene isActiveSeq(txdb) <- c(TRUE, rep(FALSE, length(isActiveSeq(txdb)) - 1)) TSSpos <- TSS(txdb) gr <- TSSpos[1:50] start(gr) <- start(gr) - 1000 end(gr) <- end(gr) - 600 pvalues <- c(runif(20,1e-20,1e-8), runif(15,1e-4,1e-2), runif(15,0.5,1)) mcols(gr) <- pvalues extgr <- GRanges(seqnames(gr), ranges= IRanges(start(gr) - 1000, end(gr) + 1000)) data <- heatmapData(grl=list(ChIPseq=gr), refgr=extgr, type='gr', useScore=TRUE, Nnorm=TRUE, Snorm=TRUE, nbins=6, txdb=txdb) rownames(data[[1]][[1]]) <- paste(1:50, signif(pvalues,1), sep=' # ') heatmapPlot(matList=data$matList, qnorm=NULL, tnorm=NULL, rowLab=TRUE, colLab=TRUE, clusterInds=1:3) dev.new() heatmapPlot(matList=data$matList, sigMat=data$scoreMat, qnorm=NULL, tnorm=NULL, rowLab=TRUE, colLab=TRUE, clusterInds=1:3) restoreSeqlevels(txdb) Results
R version 3.3.1 (2016-06-21) -- "Bug in Your Hair"
Copyright (C) 2016 The R Foundation for Statistical Computing
Platform: x86_64-pc-linux-gnu (64-bit)

R is free software and comes with ABSOLUTELY NO WARRANTY.
You are welcome to redistribute it under certain conditions.
Type 'license()' or 'licence()' for distribution details.

R is a collaborative project with many contributors.
Type 'contributors()' for more information and
'citation()' on how to cite R or R packages in publications.

Type 'demo()' for some demos, 'help()' for on-line help, or
'help.start()' for an HTML browser interface to help.
Type 'q()' to quit R.

> library(compEpiTools)
Loading required package: topGO
Loading required package: BiocGenerics
Loading required package: parallel

Attaching package: 'BiocGenerics'

The following objects are masked from 'package:parallel':

    clusterApply, clusterApplyLB, clusterCall, clusterEvalQ,
    clusterExport, clusterMap, parApply, parCapply, parLapply,
    parLapplyLB, parRapply, parSapply, parSapplyLB

The following objects are masked from 'package:stats':

    IQR, mad, xtabs

The following objects are masked from 'package:base':

    Filter, Find, Map, Position, Reduce, anyDuplicated, append,
    as.data.frame, cbind, colnames, do.call, duplicated, eval, evalq,
    get, grep, grepl, intersect, is.unsorted, lapply, lengths, mapply,
    match, mget, order, paste, pmax, pmax.int, pmin, pmin.int, rank,
    rbind, rownames, sapply, setdiff, sort, table, tapply, union,
    unique, unsplit

Loading required package: graph
Loading required package: Biobase
Welcome to Bioconductor

    Vignettes contain introductory material; view with
    'browseVignettes()'. To cite Bioconductor, see
    'citation("Biobase")', and for packages 'citation("pkgname")'.

Loading required package: GO.db
Loading required package: AnnotationDbi
Loading required package: stats4
Loading required package: IRanges
Loading required package: S4Vectors

Attaching package: 'S4Vectors'

The following objects are masked from 'package:base':

    colMeans, colSums, expand.grid, rowMeans, rowSums


Loading required package: SparseM

Attaching package: 'SparseM'

The following object is masked from 'package:base':

    backsolve


groupGOTerms: 	GOBPTerm, GOMFTerm, GOCCTerm environments built.

Attaching package: 'topGO'

The following object is masked from 'package:IRanges':

    members

Loading required package: GenomicRanges
Loading required package: GenomeInfoDb
> png(filename="/home/ddbj/snapshot/RGM3/R_BC/result/compEpiTools/heatmapPlot.Rd_%03d_medium.png", width=480, height=480)
> ### Name: heatmapPlot
> ### Title: displays the heatmap based on the data from heatmapData
> ### Aliases: heatmapPlot
>
> ### ** Examples
>
> require(TxDb.Mmusculus.UCSC.mm9.knownGene)
Loading required package: TxDb.Mmusculus.UCSC.mm9.knownGene
Loading required package: GenomicFeatures

Attaching package: 'GenomicFeatures'

The following object is masked from 'package:topGO':

    genes

> txdb <- TxDb.Mmusculus.UCSC.mm9.knownGene
> isActiveSeq(txdb) <- c(TRUE, rep(FALSE, length(isActiveSeq(txdb)) - 1))
> TSSpos <- TSS(txdb)
'select()' returned 1:1 mapping between keys and columns
> gr <- TSSpos[1:50]
> start(gr) <- start(gr) - 1000
> end(gr) <- end(gr) - 600
> pvalues <- c(runif(20,1e-20,1e-8), runif(15,1e-4,1e-2), runif(15,0.5,1))
> mcols(gr) <- pvalues
> extgr <- GRanges(seqnames(gr), ranges= IRanges(start(gr) - 1000, end(gr) + 1000))
> data <- heatmapData(grl=list(ChIPseq=gr), refgr=extgr, type='gr', useScore=TRUE,
+   Nnorm=TRUE, Snorm=TRUE, nbins=6, txdb=txdb)
[1] "ChIPseq"
> rownames(data[[1]][[1]]) <- paste(1:50, signif(pvalues,1), sep=' # ')
> heatmapPlot(matList=data$matList, qnorm=NULL, tnorm=NULL,
+   rowLab=TRUE, colLab=TRUE, clusterInds=1:3)
> dev.new()
Error in dev.new() : no suitable unused file name for pdf()
Execution halted
|