Bar plot all linkage groups, with the true chromosomes of contigs coloured.
Description
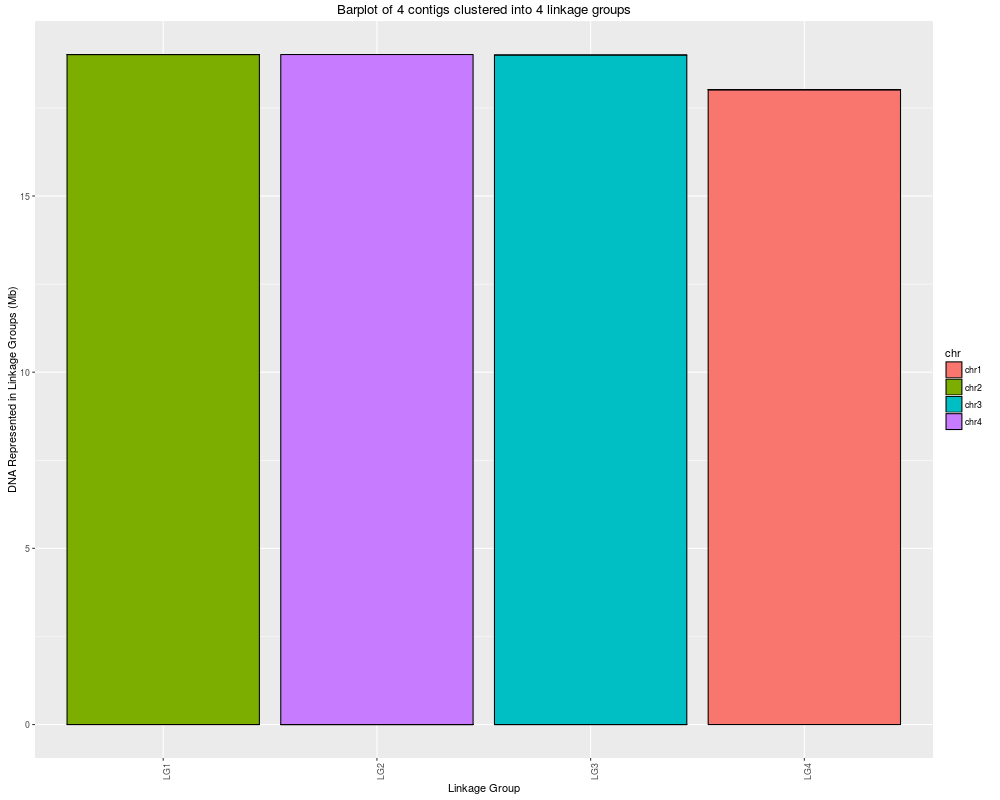
Bar plot all linkage groups, with the true chromosomes of contigs coloured.
Usage
## S4 method for signature 'LinkageGroupList,ChrTable'
barplotLinkageGroupCalls(object, chrTable,
  by = "lg", returnTable = FALSE)
Arguments
object
LinkageGroupList, as generated by clusterContigs
chrTable
GRanges object containing assembly information about the contigs, including a meta column called 'name' that has names matching the object.
Note that the rownames of chrTable should be the contig names, as they are used in object, and the first column (chromosome name) will used to order by chromosome if 'chr' option used in by parameter.
To use a bam file header, the product of makeChrTable(bamFile) is suitable for input
by
whether to plot by linkage group (if 'lg') or chromosomes ('chr')
returnTable
TRUE to return chromosome length matrix.
Note to include legend, use legend=rownames(chr.table) for by='lg', and legend=colnames(chr.table) for by='chr'
Value
a matrix of lengths of each chromosome (rows) in each linkage group (columns)
R version 3.3.1 (2016-06-21) -- "Bug in Your Hair"
Copyright (C) 2016 The R Foundation for Statistical Computing
Platform: x86_64-pc-linux-gnu (64-bit)

R is free software and comes with ABSOLUTELY NO WARRANTY.
You are welcome to redistribute it under certain conditions.
Type 'license()' or 'licence()' for distribution details.

R is a collaborative project with many contributors.
Type 'contributors()' for more information and
'citation()' on how to cite R or R packages in publications.

Type 'demo()' for some demos, 'help()' for on-line help, or
'help.start()' for an HTML browser interface to help.
Type 'q()' to quit R.

> library(contiBAIT)
Loading required package: BH
Loading required package: Rsamtools
Loading required package: GenomeInfoDb
Loading required package: stats4
Loading required package: BiocGenerics
Loading required package: parallel

Attaching package: 'BiocGenerics'

The following objects are masked from 'package:parallel':

    clusterApply, clusterApplyLB, clusterCall, clusterEvalQ,
    clusterExport, clusterMap, parApply, parCapply, parLapply,
    parLapplyLB, parRapply, parSapply, parSapplyLB

The following objects are masked from 'package:stats':

    IQR, mad, xtabs

The following objects are masked from 'package:base':

    Filter, Find, Map, Position, Reduce, anyDuplicated, append,
    as.data.frame, cbind, colnames, do.call, duplicated, eval, evalq,
    get, grep, grepl, intersect, is.unsorted, lapply, lengths, mapply,
    match, mget, order, paste, pmax, pmax.int, pmin, pmin.int, rank,
    rbind, rownames, sapply, setdiff, sort, table, tapply, union,
    unique, unsplit

Loading required package: S4Vectors

Attaching package: 'S4Vectors'

The following objects are masked from 'package:base':

    colMeans, colSums, expand.grid, rowMeans, rowSums

Loading required package: IRanges
Loading required package: GenomicRanges
Loading required package: Biostrings
Loading required package: XVector
> png(filename="/home/ddbj/snapshot/RGM3/R_BC/result/contiBAIT/barplotLinkageGroupCalls-LinkageGroupList-ChrTable-method.Rd_%03d_medium.png", width=480, height=480)
> ### Name: barplotLinkageGroupCalls,LinkageGroupList,ChrTable-method
> ### Title: Bar plot all linkage groups, with the true chromosomes of
> ###   contigs coloured.
> ### Aliases: barplotLinkageGroupCalls
> ###   barplotLinkageGroupCalls,LinkageGroupList,ChrTable-method
> ###   barplotLinkageGroupCalls,LinkageGroupList,LinkageGroupList-method,ChrTable,ChrTable-method
>
> ### ** Examples
>
> data("exampleLGList")
> data("exampleDividedChr")
>
> barplotLinkageGroupCalls(exampleLGList, exampleDividedChr)
>
>
>
>
>
>
> dev.off()
null device
          1
>
 .
.