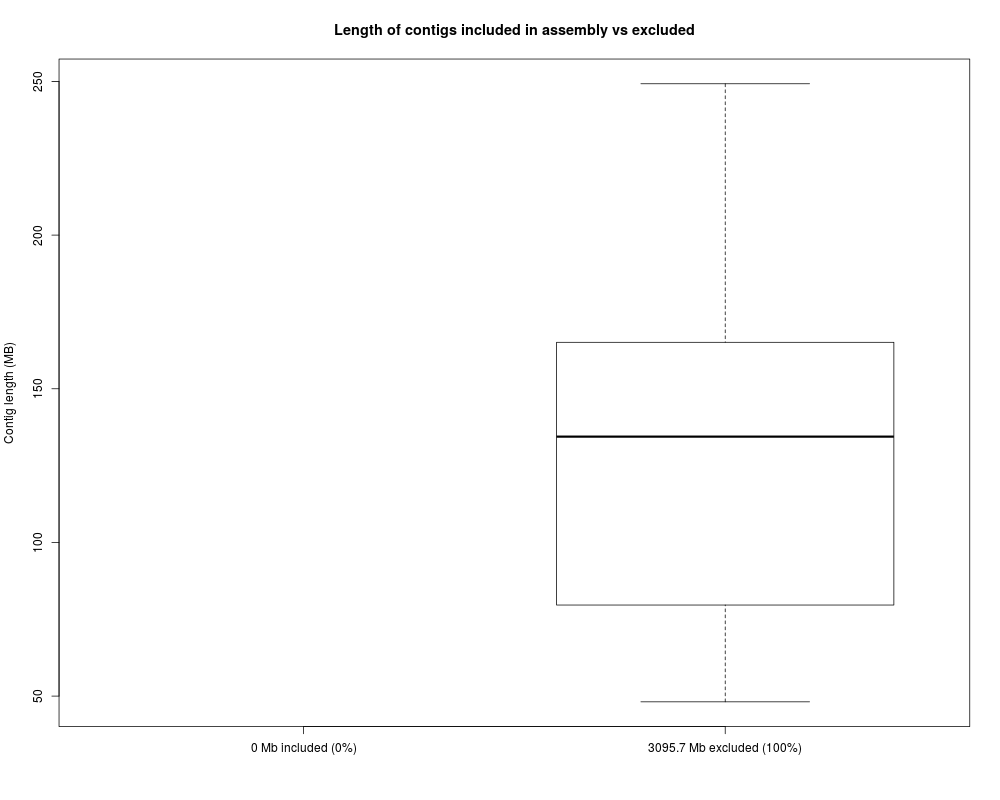
R: makeBoxPlot - creates boxplot of contigs included in the...
makeBoxPlot,ChrTable,LinkageGroupList-method
R Documentation
makeBoxPlot – creates boxplot of contigs included in the analysis vs those excluded
Description
makeBoxPlot – creates boxplot of contigs included in the analysis vs those excluded
Usage
## S4 method for signature 'ChrTable,LinkageGroupList'
makeBoxPlot(chrTable, linkage.contigs)
Arguments
chrTable
A GRanges object consisting of contigs and positions. A meta column called 'names' must be present with names in the same
format as those from linkage.contigs. Generated by makeChrTable().
linkage.contigs
A list of clustered contigs, generated by clusterContigs()
Value
a box plot of included and excluded contigs
Examples
#make an example barplot of data

data("exampleLGList")
data("exampleChrTable")
makeBoxPlot(exampleChrTable, exampleLGList)
Results
R version 3.3.1 (2016-06-21) -- "Bug in Your Hair"
Copyright (C) 2016 The R Foundation for Statistical Computing
Platform: x86_64-pc-linux-gnu (64-bit)

R is free software and comes with ABSOLUTELY NO WARRANTY.
You are welcome to redistribute it under certain conditions.
Type 'license()' or 'licence()' for distribution details.

R is a collaborative project with many contributors.
Type 'contributors()' for more information and
'citation()' on how to cite R or R packages in publications.

Type 'demo()' for some demos, 'help()' for on-line help, or
'help.start()' for an HTML browser interface to help.
Type 'q()' to quit R.

> library(contiBAIT)
Loading required package: BH
Loading required package: Rsamtools
Loading required package: GenomeInfoDb
Loading required package: stats4
Loading required package: BiocGenerics
Loading required package: parallel

Attaching package: 'BiocGenerics'

The following objects are masked from 'package:parallel':

    clusterApply, clusterApplyLB, clusterCall, clusterEvalQ,
    clusterExport, clusterMap, parApply, parCapply, parLapply,
    parLapplyLB, parRapply, parSapply, parSapplyLB

The following objects are masked from 'package:stats':

    IQR, mad, xtabs

The following objects are masked from 'package:base':

    Filter, Find, Map, Position, Reduce, anyDuplicated, append,
    as.data.frame, cbind, colnames, do.call, duplicated, eval, evalq,
    get, grep, grepl, intersect, is.unsorted, lapply, lengths, mapply,
    match, mget, order, paste, pmax, pmax.int, pmin, pmin.int, rank,
    rbind, rownames, sapply, setdiff, sort, table, tapply, union,
    unique, unsplit

Loading required package: S4Vectors

Attaching package: 'S4Vectors'

The following objects are masked from 'package:base':

    colMeans, colSums, expand.grid, rowMeans, rowSums

Loading required package: IRanges
Loading required package: GenomicRanges
Loading required package: Biostrings
Loading required package: XVector
> png(filename="/home/ddbj/snapshot/RGM3/R_BC/result/contiBAIT/makeBoxPlot.Rd_%03d_medium.png", width=480, height=480)
> ### Name: makeBoxPlot,ChrTable,LinkageGroupList-method
> ### Title: makeBoxPlot - creates boxplot of contigs included in the
> ###   analysis vs those excluded
> ### Aliases: makeBoxPlot makeBoxPlot,ChrTable,LinkageGroupList-method
> ###   makeBoxPlot-ChrTable-LinkageGroupList-method
>
> ### ** Examples
>
> #make an example barplot of data
>
> data("exampleLGList")
> data("exampleChrTable")
> makeBoxPlot(exampleChrTable, exampleLGList)
>
>
>
>
>
>
> dev.off()
null device
          1
>
 .
.