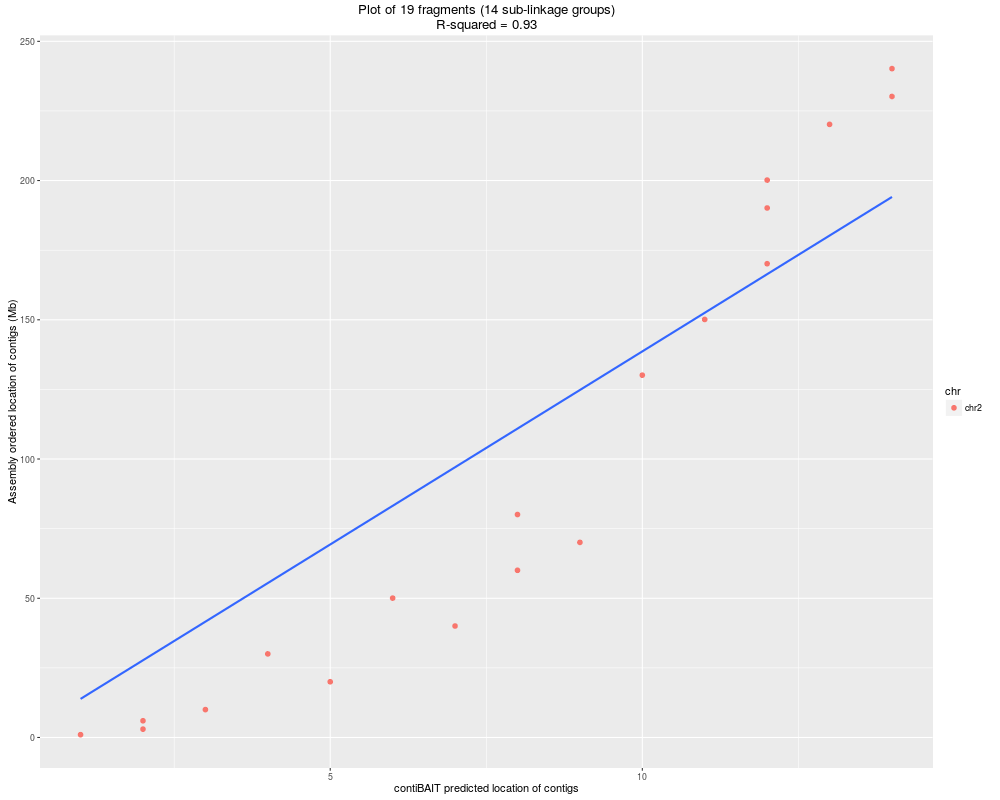
R: Plot ordering of contigs within a single linkage group.
plotContigOrder
R Documentation
Plot ordering of contigs within a single linkage group.
Description
Plot ordering of contigs within a single linkage group.
Usage
plotContigOrder(contigOrder, lg)
Arguments
contigOrder
matrix from orderAllContigs with the subdivided linkage groups and the names of the contigs to plot
lg
Integer specifying the linkage group by which to plot
Value
A ggplot object (which will be plotted automatically if not assigned).
Examples
#Get a data.frame of ordered contigs from cells from the same organism, aligned to the same genome

data("exampleLGList")
data("exampleWCMatrix")
data("exampleStrandFreq")
data("exampleReadCounts")
contigOrder <- orderAllLinkageGroups(exampleLGList,
								     exampleWCMatrix,
								     exampleStrandFreq,
								     exampleReadCounts)
plotContigOrder(contigOrder)
Results
R version 3.3.1 (2016-06-21) -- "Bug in Your Hair"
Copyright (C) 2016 The R Foundation for Statistical Computing
Platform: x86_64-pc-linux-gnu (64-bit)

R is free software and comes with ABSOLUTELY NO WARRANTY.
You are welcome to redistribute it under certain conditions.
Type 'license()' or 'licence()' for distribution details.

R is a collaborative project with many contributors.
Type 'contributors()' for more information and
'citation()' on how to cite R or R packages in publications.

Type 'demo()' for some demos, 'help()' for on-line help, or
'help.start()' for an HTML browser interface to help.
Type 'q()' to quit R.

> library(contiBAIT)
Loading required package: BH
Loading required package: Rsamtools
Loading required package: GenomeInfoDb
Loading required package: stats4
Loading required package: BiocGenerics
Loading required package: parallel

Attaching package: 'BiocGenerics'

The following objects are masked from 'package:parallel':

    clusterApply, clusterApplyLB, clusterCall, clusterEvalQ,
    clusterExport, clusterMap, parApply, parCapply, parLapply,
    parLapplyLB, parRapply, parSapply, parSapplyLB

The following objects are masked from 'package:stats':

    IQR, mad, xtabs

The following objects are masked from 'package:base':

    Filter, Find, Map, Position, Reduce, anyDuplicated, append,
    as.data.frame, cbind, colnames, do.call, duplicated, eval, evalq,
    get, grep, grepl, intersect, is.unsorted, lapply, lengths, mapply,
    match, mget, order, paste, pmax, pmax.int, pmin, pmin.int, rank,
    rbind, rownames, sapply, setdiff, sort, table, tapply, union,
    unique, unsplit

Loading required package: S4Vectors

Attaching package: 'S4Vectors'

The following objects are masked from 'package:base':

    colMeans, colSums, expand.grid, rowMeans, rowSums

Loading required package: IRanges
Loading required package: GenomicRanges
Loading required package: Biostrings
Loading required package: XVector
> png(filename="/home/ddbj/snapshot/RGM3/R_BC/result/contiBAIT/plotContigOrder.Rd_%03d_medium.png", width=480, height=480)
> ### Name: plotContigOrder
> ### Title: Plot ordering of contigs within a single linkage group.
> ### Aliases: plotContigOrder
>
> ### ** Examples
>
> #Get a data.frame of ordered contigs from cells from the same organism, aligned to the same genome
>
> data("exampleLGList")
> data("exampleWCMatrix")
> data("exampleStrandFreq")
> data("exampleReadCounts")
> contigOrder <- orderAllLinkageGroups(exampleLGList,
+ 								     exampleWCMatrix,
+ 								     exampleStrandFreq,
+ 								     exampleReadCounts)
-> Ordering fragments in LG1
     -> Found better ordering!
-> Ordering fragments in LG2
     -> Found better ordering!
-> Ordering fragments in LG3
     -> Found better ordering!
-> Ordering fragments in LG4
     -> Found better ordering!
     -> Found better ordering!
     -> Found better ordering!
> plotContigOrder(contigOrder)
Warning message:
In grep(paste(unique(masterGroups)[lg], "\.", sep = ""), contigOrder[,  :
  argument 'pattern' has length > 1 and only the first element will be used
>
>
>
>
>
> dev.off()
null device
          1
>
 .
.