Supported by Dr. Osamu Ogasawara and  . . |
|
Last data update: 2014.03.03 |
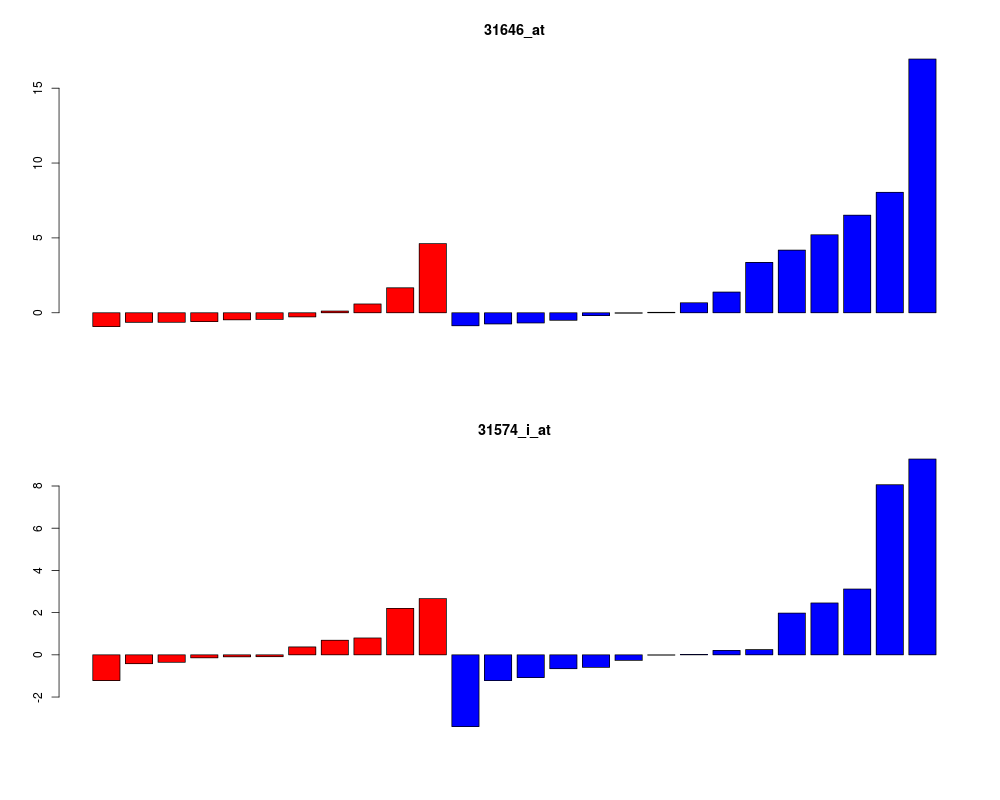
Plot Gene Pairs fom the Results of Running copaDescriptionThis function can be used to visualize pairs of genes that may be involved in recurrent gene fusion in cancer. UsageplotCopa(copa, idx, lib = NULL, sort = TRUE, col = NULL, legend = NULL) Arguments
DetailsNote that this function will output all the gene pairs in the idx
vector without pausing. This can be controlled by either setting
par(ask = TRUE), or by redirecting the output to a file (using e.g.,
ValueThis function is called solely for outputting plots. No values are returned. Author(s)James W. MacDonald ReferencesTomlins, SA, et al. Recurrent fusion of TMPRSS2 and ETS transcription factor genes in prostate cancer. Science. 2005 Oct 28;310(5748):644-8. Examples
if(interactive()){
library(Biobase)
data(sample.ExpressionSet)
cl <- abs(3 - as.numeric(pData(sample.ExpressionSet)[,2]))
tmp <- copa(sample.ExpressionSet, cl)
plotCopa(tmp, 1, col = c("red", "blue"))
}
Results
R version 3.3.1 (2016-06-21) -- "Bug in Your Hair"
Copyright (C) 2016 The R Foundation for Statistical Computing
Platform: x86_64-pc-linux-gnu (64-bit)

R is free software and comes with ABSOLUTELY NO WARRANTY.
You are welcome to redistribute it under certain conditions.
Type 'license()' or 'licence()' for distribution details.

R is a collaborative project with many contributors.
Type 'contributors()' for more information and
'citation()' on how to cite R or R packages in publications.

Type 'demo()' for some demos, 'help()' for on-line help, or
'help.start()' for an HTML browser interface to help.
Type 'q()' to quit R.

> library(copa)
Loading required package: Biobase
Loading required package: BiocGenerics
Loading required package: parallel

Attaching package: 'BiocGenerics'

The following objects are masked from 'package:parallel':

    clusterApply, clusterApplyLB, clusterCall, clusterEvalQ,
    clusterExport, clusterMap, parApply, parCapply, parLapply,
    parLapplyLB, parRapply, parSapply, parSapplyLB

The following objects are masked from 'package:stats':

    IQR, mad, xtabs

The following objects are masked from 'package:base':

    Filter, Find, Map, Position, Reduce, anyDuplicated, append,
    as.data.frame, cbind, colnames, do.call, duplicated, eval, evalq,
    get, grep, grepl, intersect, is.unsorted, lapply, lengths, mapply,
    match, mget, order, paste, pmax, pmax.int, pmin, pmin.int, rank,
    rbind, rownames, sapply, setdiff, sort, table, tapply, union,
    unique, unsplit

Welcome to Bioconductor

    Vignettes contain introductory material; view with
    'browseVignettes()'. To cite Bioconductor, see
    'citation("Biobase")', and for packages 'citation("pkgname")'.

> png(filename="/home/ddbj/snapshot/RGM3/R_BC/result/copa/plotCopa.Rd_%03d_medium.png", width=480, height=480)
> ### Name: plotCopa
> ### Title: Plot Gene Pairs fom the Results of Running copa
> ### Aliases: plotCopa
> ### Keywords: hplot
>
> ### ** Examples
>
> #if(interactive()){
> library(Biobase)
> data(sample.ExpressionSet)
> cl <- abs(3 - as.numeric(pData(sample.ExpressionSet)[,2]))
> tmp <- copa(sample.ExpressionSet, cl)
> plotCopa(tmp, 1, col = c("red", "blue"))
> #}
>
>
>
>
>
> dev.off()
null device
          1
>
|