Supported by Dr. Osamu Ogasawara and  . . |
|
Last data update: 2014.03.03 |
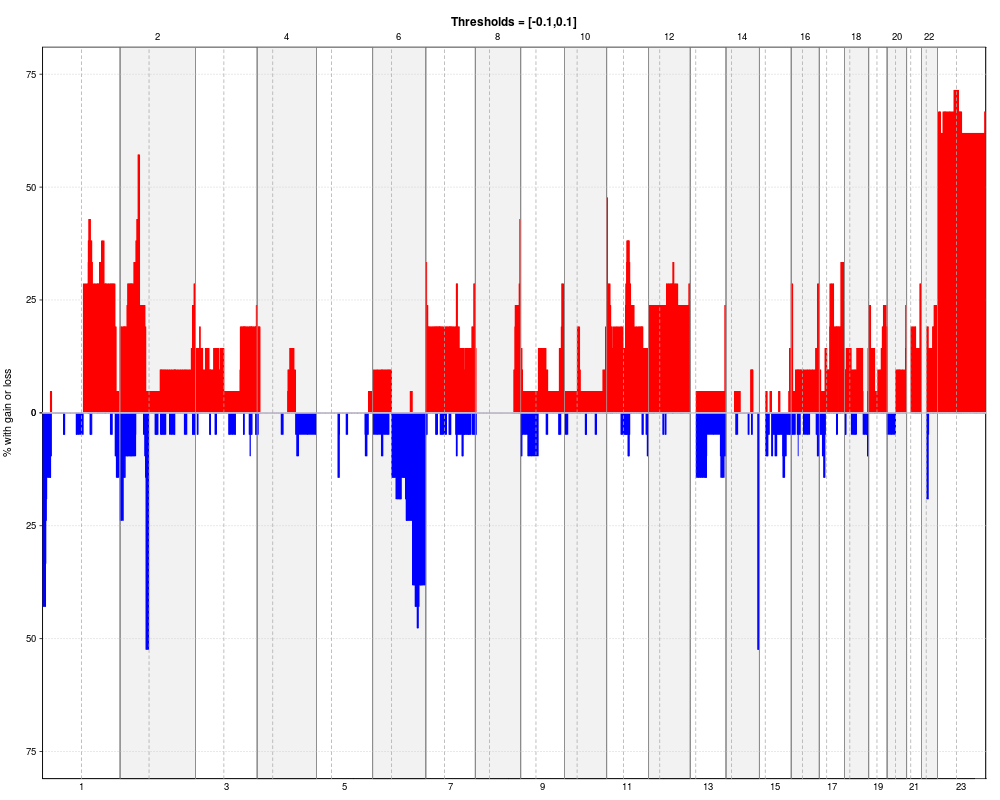
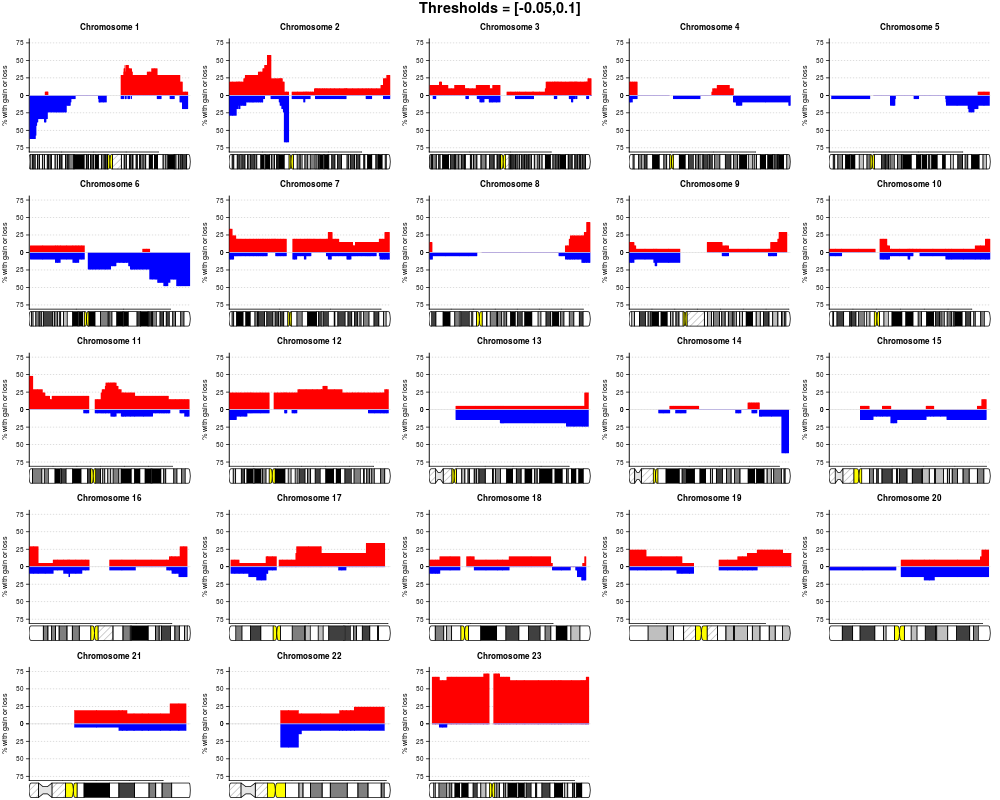
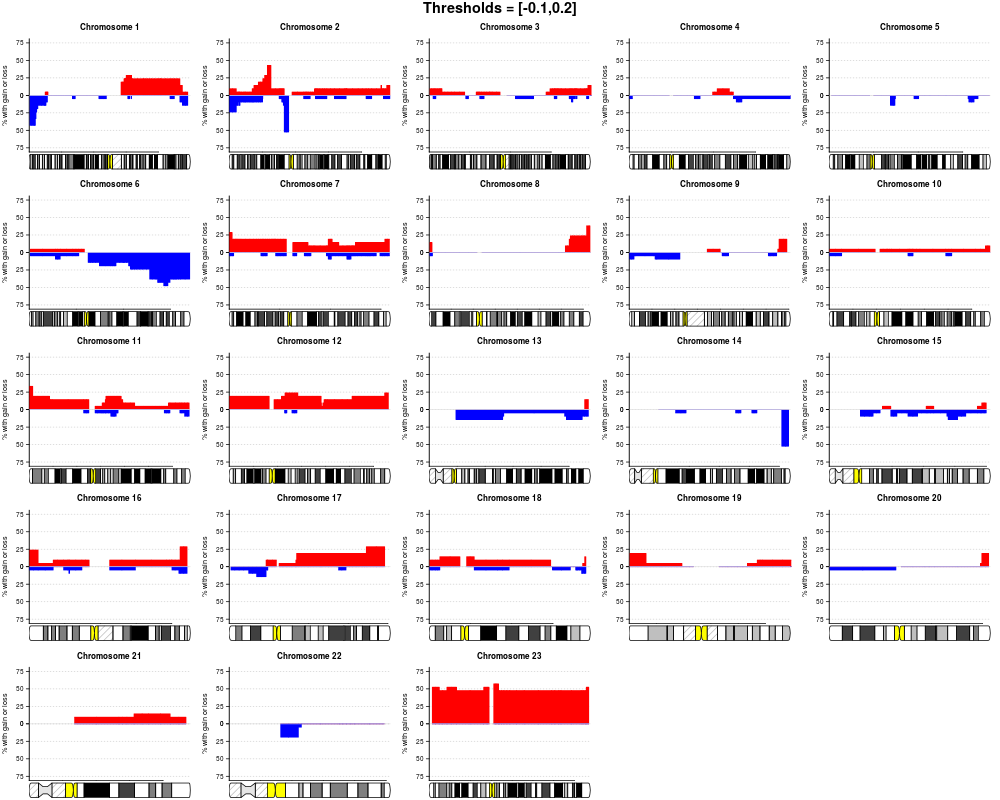
Plot percentage of samples with an aberration at a genomic positionDescriptionPlot the percentage of samples that have an amplification or deletion at a genomic position. Amplifications/deletions correspond to copy number values that are above/below a pre-defined threshold. Frequencies may be plotted over the entire genome or separately for each chromosome. Usage
plotFreq(segments, thres.gain, thres.loss = -thres.gain, pos.unit = "bp",
    chrom = NULL, layout = c(1, 1),...)
Arguments
DetailsThe percentage of samples with an aberration is calculated and plotted for all genomic positions. Regions with gain or loss will be those where copy number values are above or below the values given in NoteThis function applies Author(s)Gro Nilsen Examples#load lymphoma data data(lymphoma) #Run pcf seg <- pcf(data=lymphoma,gamma=12) #Plot over entire genome, gain and loss thresholds are 0.1 and -0.1: plotFreq(segments=seg,thres.gain=0.1) #Plot by chromosomes, two sets of thresholds: plotFreq(segments=seg,thres.gain=c(0.1,0.2), thres.loss=c(-0.05,-0.1), chrom=c(1:23), layout=c(5,5)) Results
R version 3.3.1 (2016-06-21) -- "Bug in Your Hair"
Copyright (C) 2016 The R Foundation for Statistical Computing
Platform: x86_64-pc-linux-gnu (64-bit)

R is free software and comes with ABSOLUTELY NO WARRANTY.
You are welcome to redistribute it under certain conditions.
Type 'license()' or 'licence()' for distribution details.

R is a collaborative project with many contributors.
Type 'contributors()' for more information and
'citation()' on how to cite R or R packages in publications.

Type 'demo()' for some demos, 'help()' for on-line help, or
'help.start()' for an HTML browser interface to help.
Type 'q()' to quit R.

> library(copynumber)
Loading required package: BiocGenerics
Loading required package: parallel

Attaching package: 'BiocGenerics'

The following objects are masked from 'package:parallel':

    clusterApply, clusterApplyLB, clusterCall, clusterEvalQ,
    clusterExport, clusterMap, parApply, parCapply, parLapply,
    parLapplyLB, parRapply, parSapply, parSapplyLB

The following objects are masked from 'package:stats':

    IQR, mad, xtabs

The following objects are masked from 'package:base':

    Filter, Find, Map, Position, Reduce, anyDuplicated, append,
    as.data.frame, cbind, colnames, do.call, duplicated, eval, evalq,
    get, grep, grepl, intersect, is.unsorted, lapply, lengths, mapply,
    match, mget, order, paste, pmax, pmax.int, pmin, pmin.int, rank,
    rbind, rownames, sapply, setdiff, sort, table, tapply, union,
    unique, unsplit

> png(filename="/home/ddbj/snapshot/RGM3/R_BC/result/copynumber/plotFreq.Rd_%03d_medium.png", width=480, height=480)
> ### Name: plotFreq
> ### Title: Plot percentage of samples with an aberration at a genomic
> ###   position
> ### Aliases: plotFreq
>
> ### ** Examples
>
> #load lymphoma data
> data(lymphoma)
> #Run pcf
> seg <- pcf(data=lymphoma,gamma=12)
pcf finished for chromosome arm 1p
pcf finished for chromosome arm 1q
pcf finished for chromosome arm 2p
pcf finished for chromosome arm 2q
pcf finished for chromosome arm 3p
pcf finished for chromosome arm 3q
pcf finished for chromosome arm 4p
pcf finished for chromosome arm 4q
pcf finished for chromosome arm 5p
pcf finished for chromosome arm 5q
pcf finished for chromosome arm 6p
pcf finished for chromosome arm 6q
pcf finished for chromosome arm 7p
pcf finished for chromosome arm 7q
pcf finished for chromosome arm 8p
pcf finished for chromosome arm 8q
pcf finished for chromosome arm 9p
pcf finished for chromosome arm 9q
pcf finished for chromosome arm 10p
pcf finished for chromosome arm 10q
pcf finished for chromosome arm 11p
pcf finished for chromosome arm 11q
pcf finished for chromosome arm 12p
pcf finished for chromosome arm 12q
pcf finished for chromosome arm 13q
pcf finished for chromosome arm 14q
pcf finished for chromosome arm 15q
pcf finished for chromosome arm 16p
pcf finished for chromosome arm 16q
pcf finished for chromosome arm 17p
pcf finished for chromosome arm 17q
pcf finished for chromosome arm 18p
pcf finished for chromosome arm 18q
pcf finished for chromosome arm 19p
pcf finished for chromosome arm 19q
pcf finished for chromosome arm 20p
pcf finished for chromosome arm 20q
pcf finished for chromosome arm 21q
pcf finished for chromosome arm 22q
pcf finished for chromosome arm 23p
pcf finished for chromosome arm 23q
>
> #Plot over entire genome, gain and loss thresholds are 0.1 and -0.1:
> plotFreq(segments=seg,thres.gain=0.1)
>
> #Plot by chromosomes, two sets of thresholds:
> plotFreq(segments=seg,thres.gain=c(0.1,0.2), thres.loss=c(-0.05,-0.1), chrom=c(1:23),
+ layout=c(5,5))
>
>
>
>
>
>
>
> dev.off()
null device
          1
>
|